Fig. 4
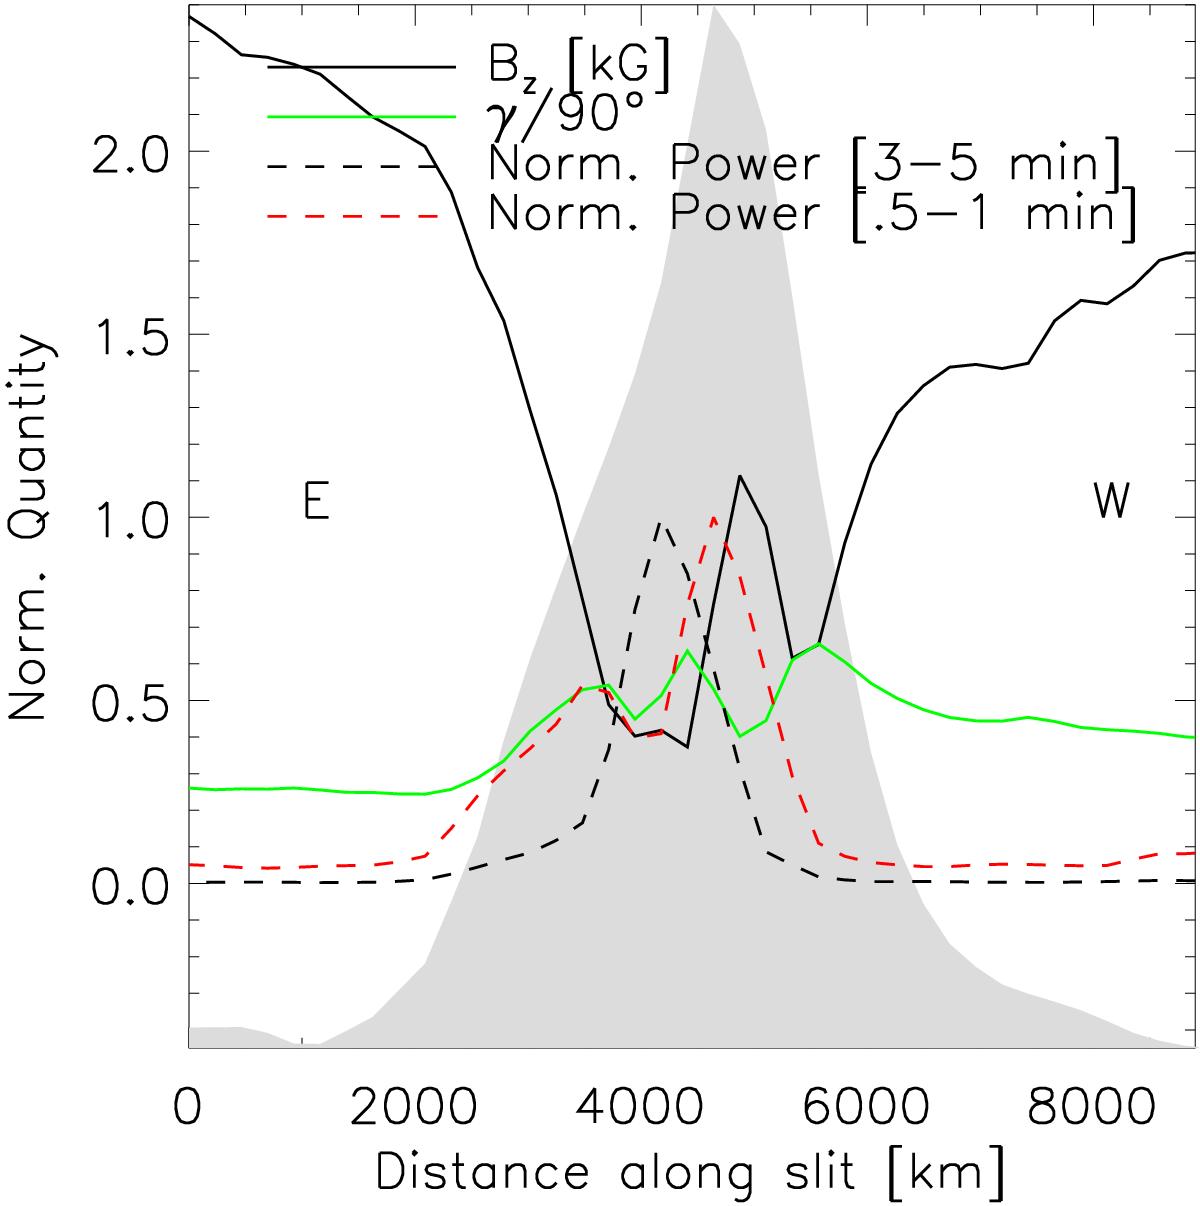
Profiles of local normal magnetic field strength Bz, field inclination γ/ 90°, and the normalized powers of five and sub-minute oscillations along the arrow labelled in Fig. 3a. The grey shaded region plots the intensity variation of the 1600 Å (scaled to the plot range), and provides a reference for the position of the light bridge.
Current usage metrics show cumulative count of Article Views (full-text article views including HTML views, PDF and ePub downloads, according to the available data) and Abstracts Views on Vision4Press platform.
Data correspond to usage on the plateform after 2015. The current usage metrics is available 48-96 hours after online publication and is updated daily on week days.
Initial download of the metrics may take a while.