Fig. 3
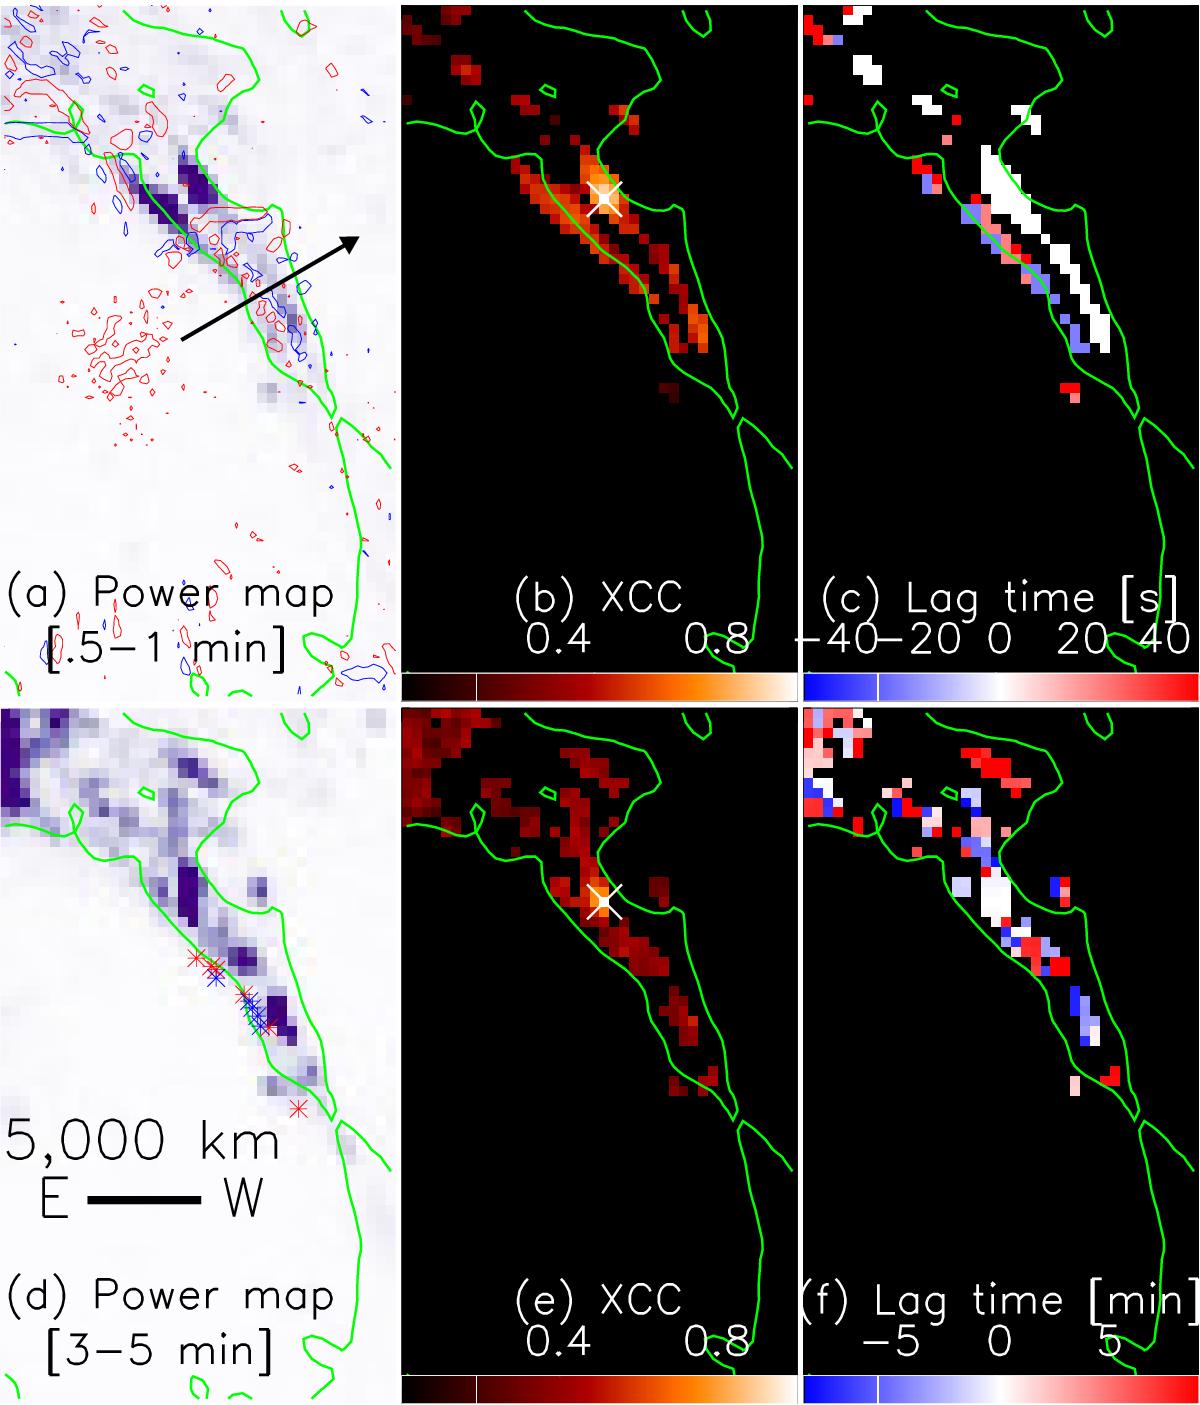
a), d) Distributions of the Fourier powers of the sub-minute and five-minute oscillations; b), c) distributions of XCC and lag time of the sub-minute oscillations; e), f) are the counterparts of the five-minute oscillations. The green contour in each panel provides a reference of the light bridge structure at the upper photosphere. The red and blue contours in a) labels the electric current density jz = ± 40 mA m-2, respectively. The red and blue asterisks in d) denotes the base of the jet activities detected at time intervals of 16:00−18:10 UT and 20:20−24:00 UT, respectively.
Current usage metrics show cumulative count of Article Views (full-text article views including HTML views, PDF and ePub downloads, according to the available data) and Abstracts Views on Vision4Press platform.
Data correspond to usage on the plateform after 2015. The current usage metrics is available 48-96 hours after online publication and is updated daily on week days.
Initial download of the metrics may take a while.