Fig. 1
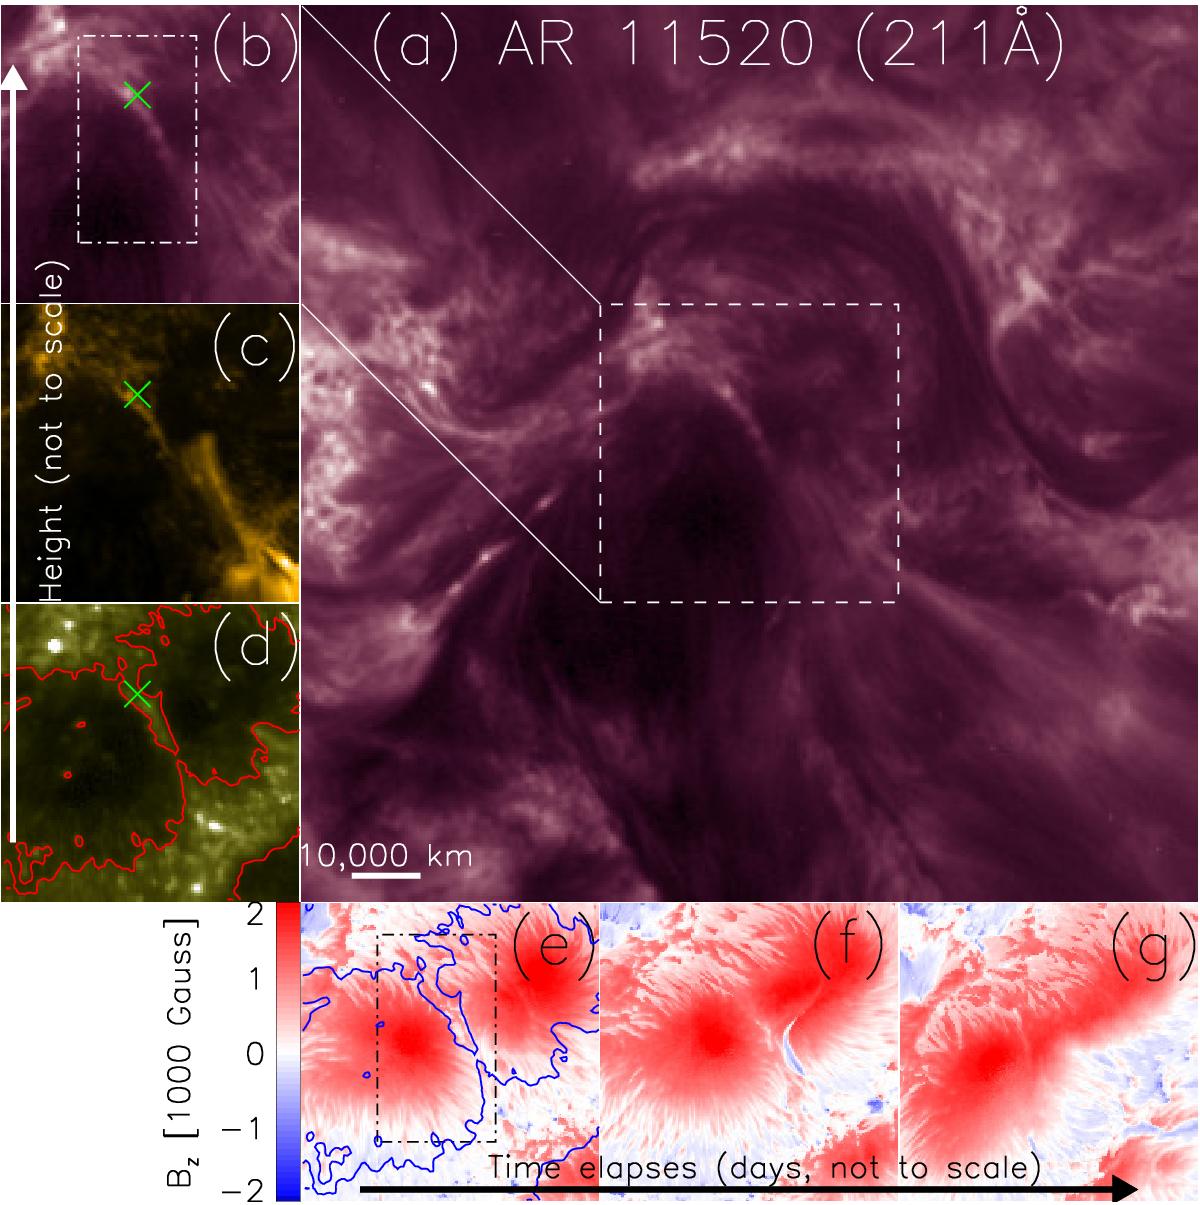
a) Field of view (FOV) of active region AR 11520 observed in the AIA 211 Å channel on 11 July 2012. The active region is relatively clear of coronal loops and other complex coronal structures, therefore, the light bridge is easily identifiable. Smaller FOV (as enclosed in the dashed rectangle in a)) observed in the AIA b) 211 Å (2 000 000 K), c)171 Å (600 000 K), and d) 1600 Å (5000 K) channels, respectively. The green crosses label the pixel where time series were extracted and analysed in Fig. 2. The dot-dashed rectangle in b) indicates the area where power maps are calculated and analysed in Fig. 3. e)−g) Evolution of the local normal magnetic field measured by Hinode SOT/SP on 11, 13, and 14 July 2012, respectively. The contours in d) and e) show the light bridge structure at upper photosphere (1600 Å) as a reference.
Current usage metrics show cumulative count of Article Views (full-text article views including HTML views, PDF and ePub downloads, according to the available data) and Abstracts Views on Vision4Press platform.
Data correspond to usage on the plateform after 2015. The current usage metrics is available 48-96 hours after online publication and is updated daily on week days.
Initial download of the metrics may take a while.