Fig. 9
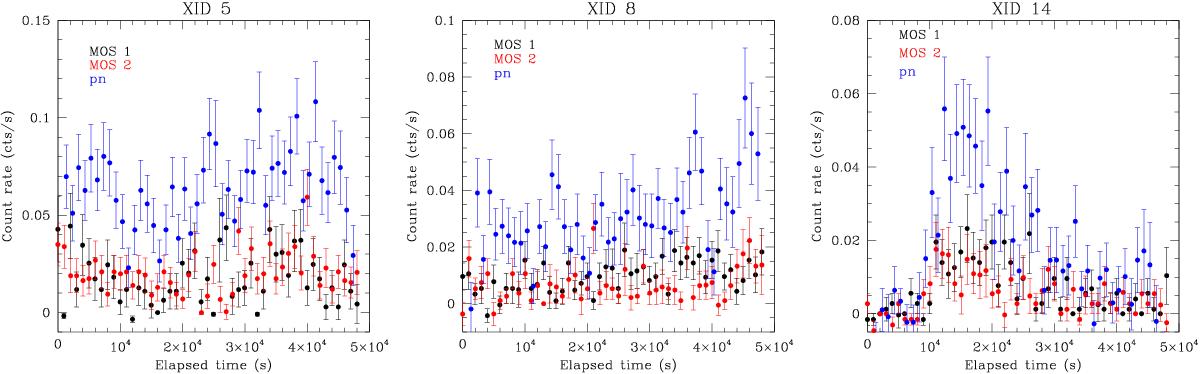
EPIC light curves of three secondary sources in the field of IC 1805: XID 5, 8, and 14, from left to right. Black, red, and blue correspond to count rates measured with the EPIC-MOS1, MOS2, and pn cameras, respectively. The light curves were extracted with time bins of 1 ks. Time zero corresponds to the beginning of our XMM-Newton observation.
Current usage metrics show cumulative count of Article Views (full-text article views including HTML views, PDF and ePub downloads, according to the available data) and Abstracts Views on Vision4Press platform.
Data correspond to usage on the plateform after 2015. The current usage metrics is available 48-96 hours after online publication and is updated daily on week days.
Initial download of the metrics may take a while.