Free Access
Fig. 6
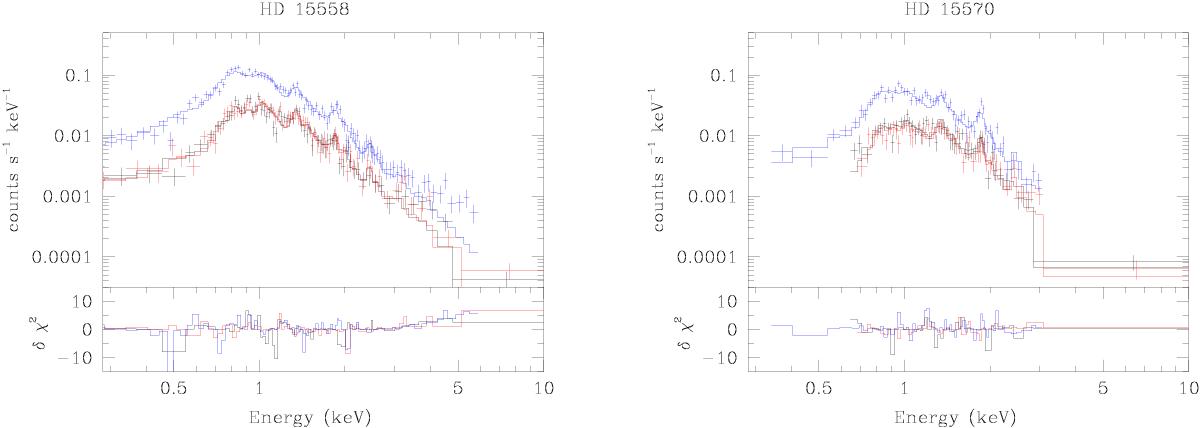
Left: comparison of the EPIC spectra of HD 15558 with the best-fit model quoted in Table 4. Black, red, and blue colours refer to the spectra obtained with the EPIC-MOS1, MOS2, and pn detectors, respectively. Right: same for HD 15570.
This figure is made of several images, please see below:
Current usage metrics show cumulative count of Article Views (full-text article views including HTML views, PDF and ePub downloads, according to the available data) and Abstracts Views on Vision4Press platform.
Data correspond to usage on the plateform after 2015. The current usage metrics is available 48-96 hours after online publication and is updated daily on week days.
Initial download of the metrics may take a while.