Fig. A.2
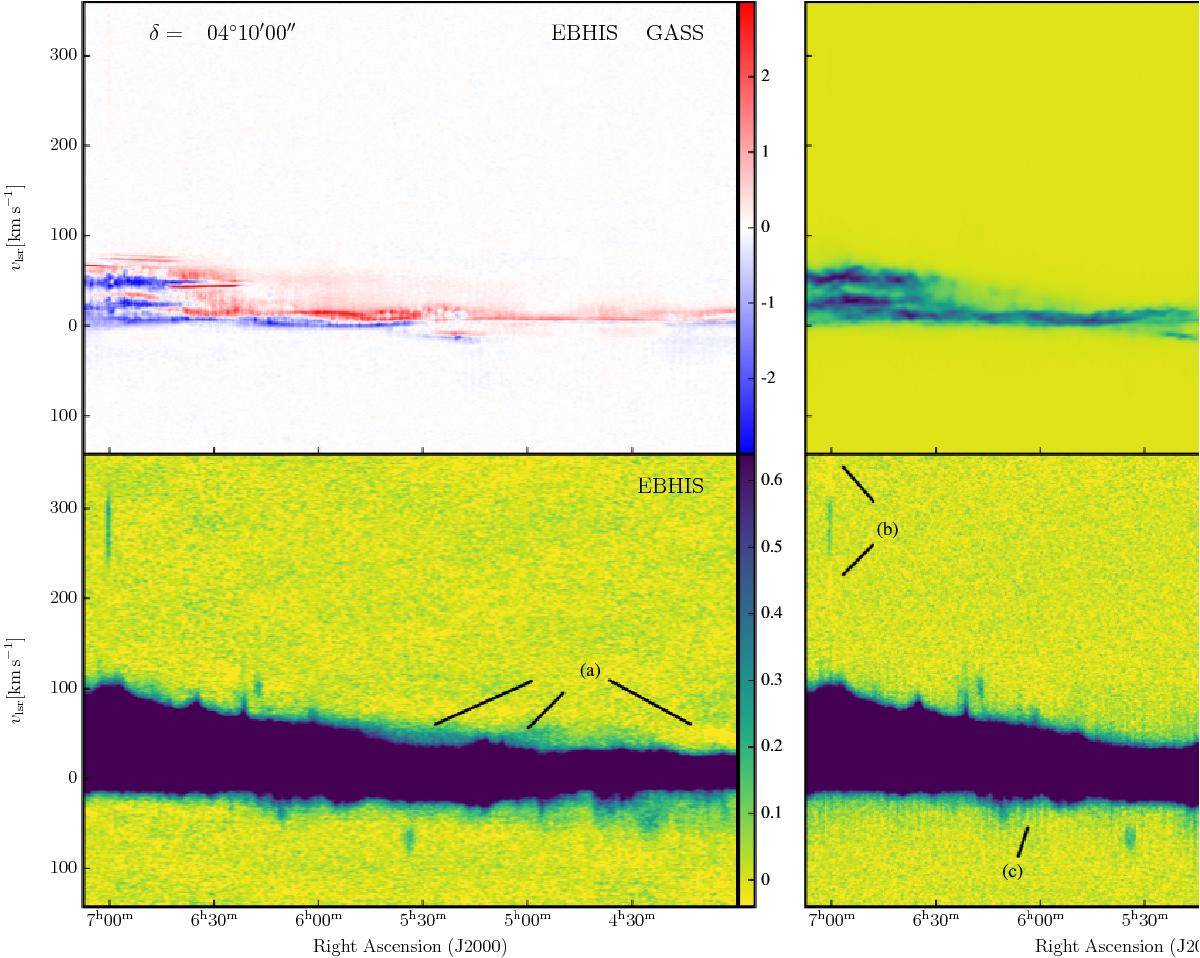
Typical EBHIS and GASS baseline problems. The four panels show a position-velocity slice of the overlap-region datacube. Top left panel: difference between EBHIS and GASS, top right panel: GASS data, and bottom panels: EBHIS and GASS data with a zoomed-in intensity scale. The labeled features are: a) larger-angular scale baseline fluctuations in direct vicinity of the Milky Way disk H i profile in EBHIS data; b) baseline deficiencies around non-disk objects in GASS, caused by improper flagging; and c) increase in baseline level associated to the rectangular pattern visible in Fig. A.1. All colorbars show brightness temperature, TB, in units of Kelvin. See text for further discussion.
Current usage metrics show cumulative count of Article Views (full-text article views including HTML views, PDF and ePub downloads, according to the available data) and Abstracts Views on Vision4Press platform.
Data correspond to usage on the plateform after 2015. The current usage metrics is available 48-96 hours after online publication and is updated daily on week days.
Initial download of the metrics may take a while.