Fig. A.1
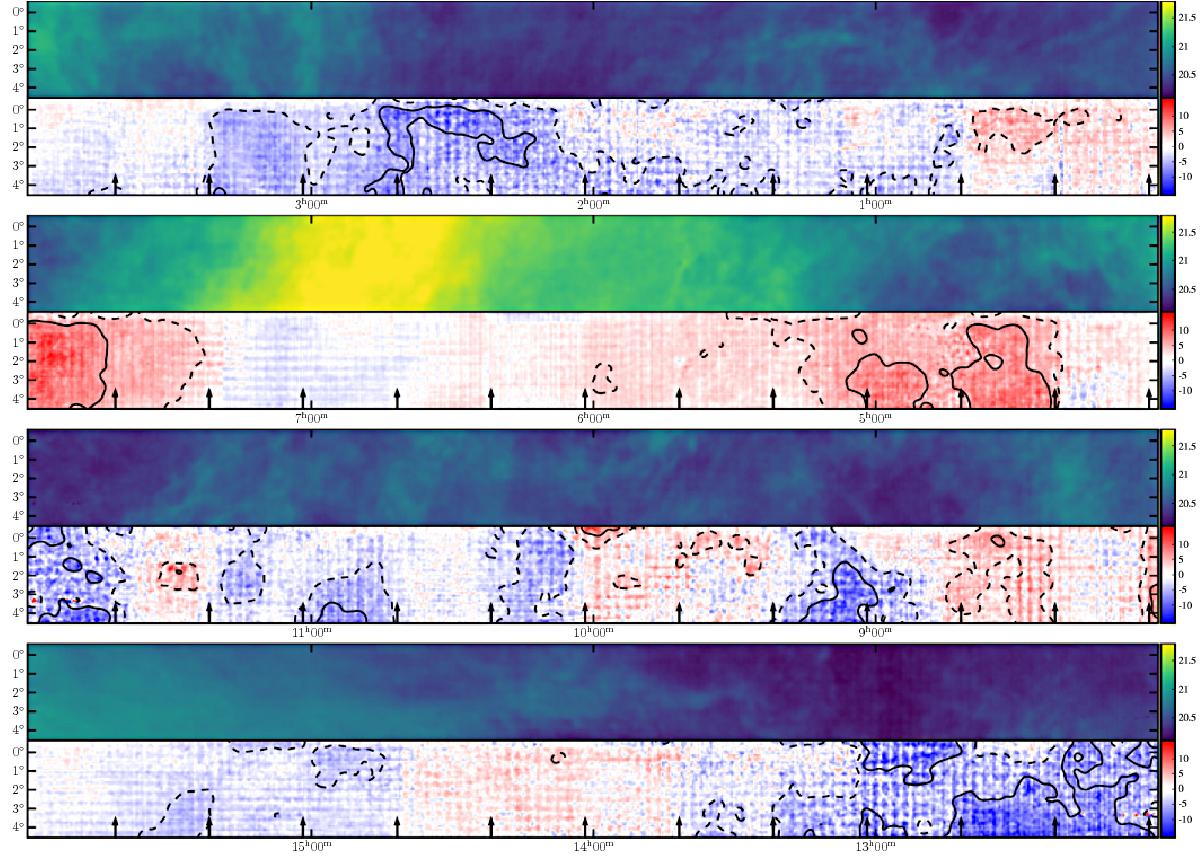
EBHIS vs. GASS column densities in the right ascension range 0h to 16h. The upper panel in each stripe shows ![]() , the lower panels show the relative difference
, the lower panels show the relative difference ![]() in percent. For convenience, each of the lower panels also contains contour levels for ± 3% (dashed lines) and ± 6% (solid lines), as well as black arrows to mark the EBHIS field limits.
in percent. For convenience, each of the lower panels also contains contour levels for ± 3% (dashed lines) and ± 6% (solid lines), as well as black arrows to mark the EBHIS field limits.
Current usage metrics show cumulative count of Article Views (full-text article views including HTML views, PDF and ePub downloads, according to the available data) and Abstracts Views on Vision4Press platform.
Data correspond to usage on the plateform after 2015. The current usage metrics is available 48-96 hours after online publication and is updated daily on week days.
Initial download of the metrics may take a while.