Fig. 3
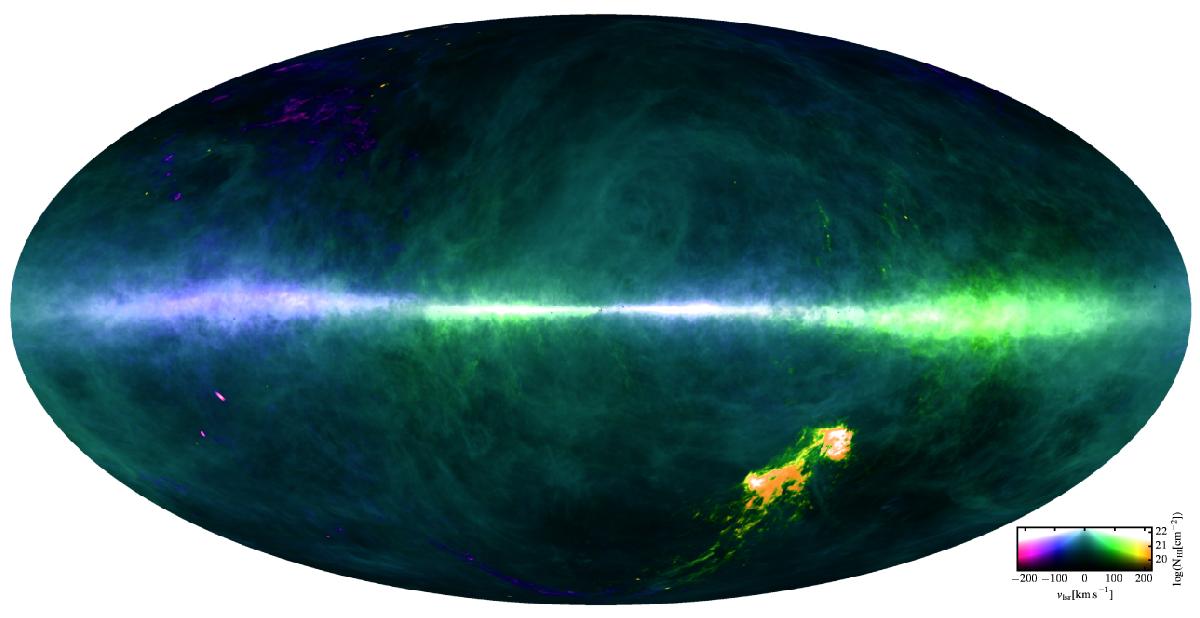
All-sky composite map of the first two moments of the H i distribution using the same coordinate system and map projection as Fig. 2. The Moment-0 (the column density) determines brightness (log-scale), while the Moment-1 (intensity-weighted radial velocities) is encoded as different hues. The brightness is furthermore modified according to the velocity scale, to render the weaker intermediate- and high-velocity gas more visible. We note that radial velocities in excess of the displayed color scale are subject to clipping: the true radial velocities of red and orange features may be larger than what the colors denote.
Current usage metrics show cumulative count of Article Views (full-text article views including HTML views, PDF and ePub downloads, according to the available data) and Abstracts Views on Vision4Press platform.
Data correspond to usage on the plateform after 2015. The current usage metrics is available 48-96 hours after online publication and is updated daily on week days.
Initial download of the metrics may take a while.