Fig. 1
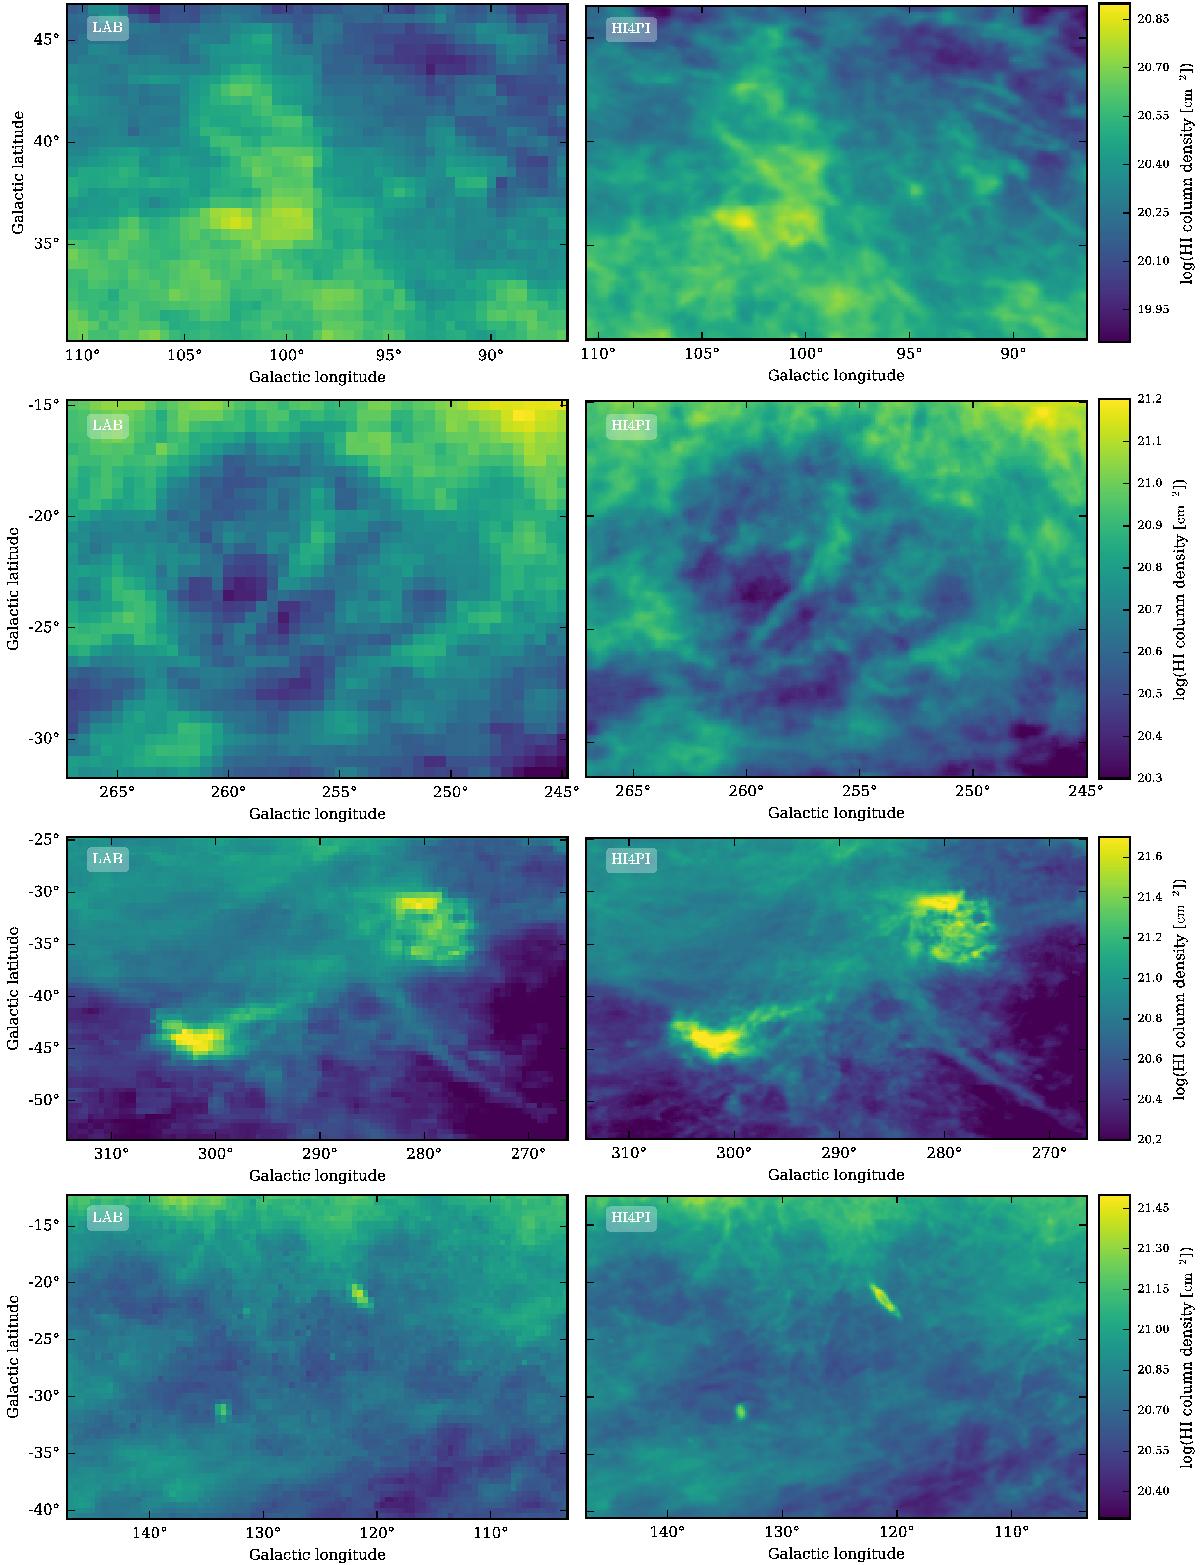
Comparison between LAB and HI4PI column densities for selected regions, which are further discussed in Sect. 3.3. The top row shows the Draco cloud, the second and the third row contain a part of the Leading Arm of the Magellanic Cloud system, including the SMC and LMC, respectively. The bottom row displays the environment of M 31 and M 33.
Current usage metrics show cumulative count of Article Views (full-text article views including HTML views, PDF and ePub downloads, according to the available data) and Abstracts Views on Vision4Press platform.
Data correspond to usage on the plateform after 2015. The current usage metrics is available 48-96 hours after online publication and is updated daily on week days.
Initial download of the metrics may take a while.