Free Access
Fig. 8
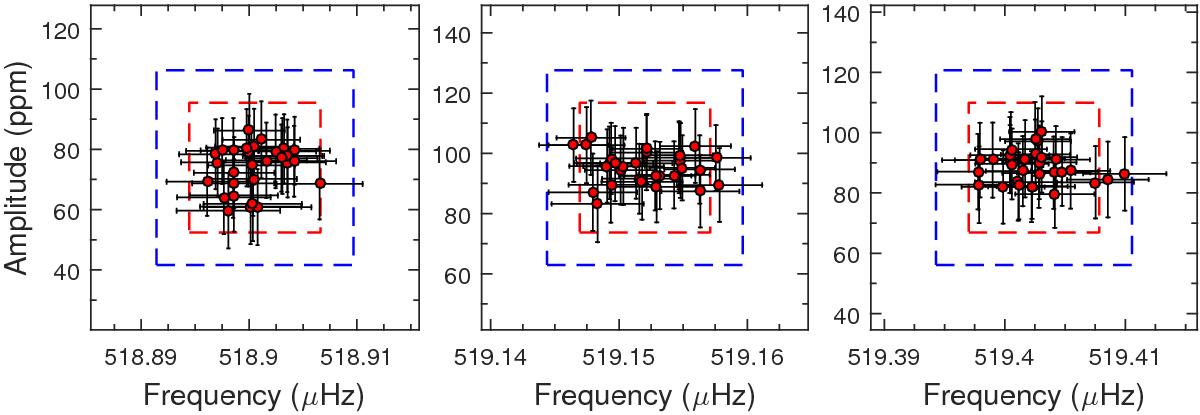
Frequency and amplitude scattering for the three components forming the g-mode triplet T3 around their averaged values. The red and blue dashed rectangles indicate the 2σ and 3σ error boxes, respectively. All the data points are within 3σ.
Current usage metrics show cumulative count of Article Views (full-text article views including HTML views, PDF and ePub downloads, according to the available data) and Abstracts Views on Vision4Press platform.
Data correspond to usage on the plateform after 2015. The current usage metrics is available 48-96 hours after online publication and is updated daily on week days.
Initial download of the metrics may take a while.