Free Access
Fig. 5
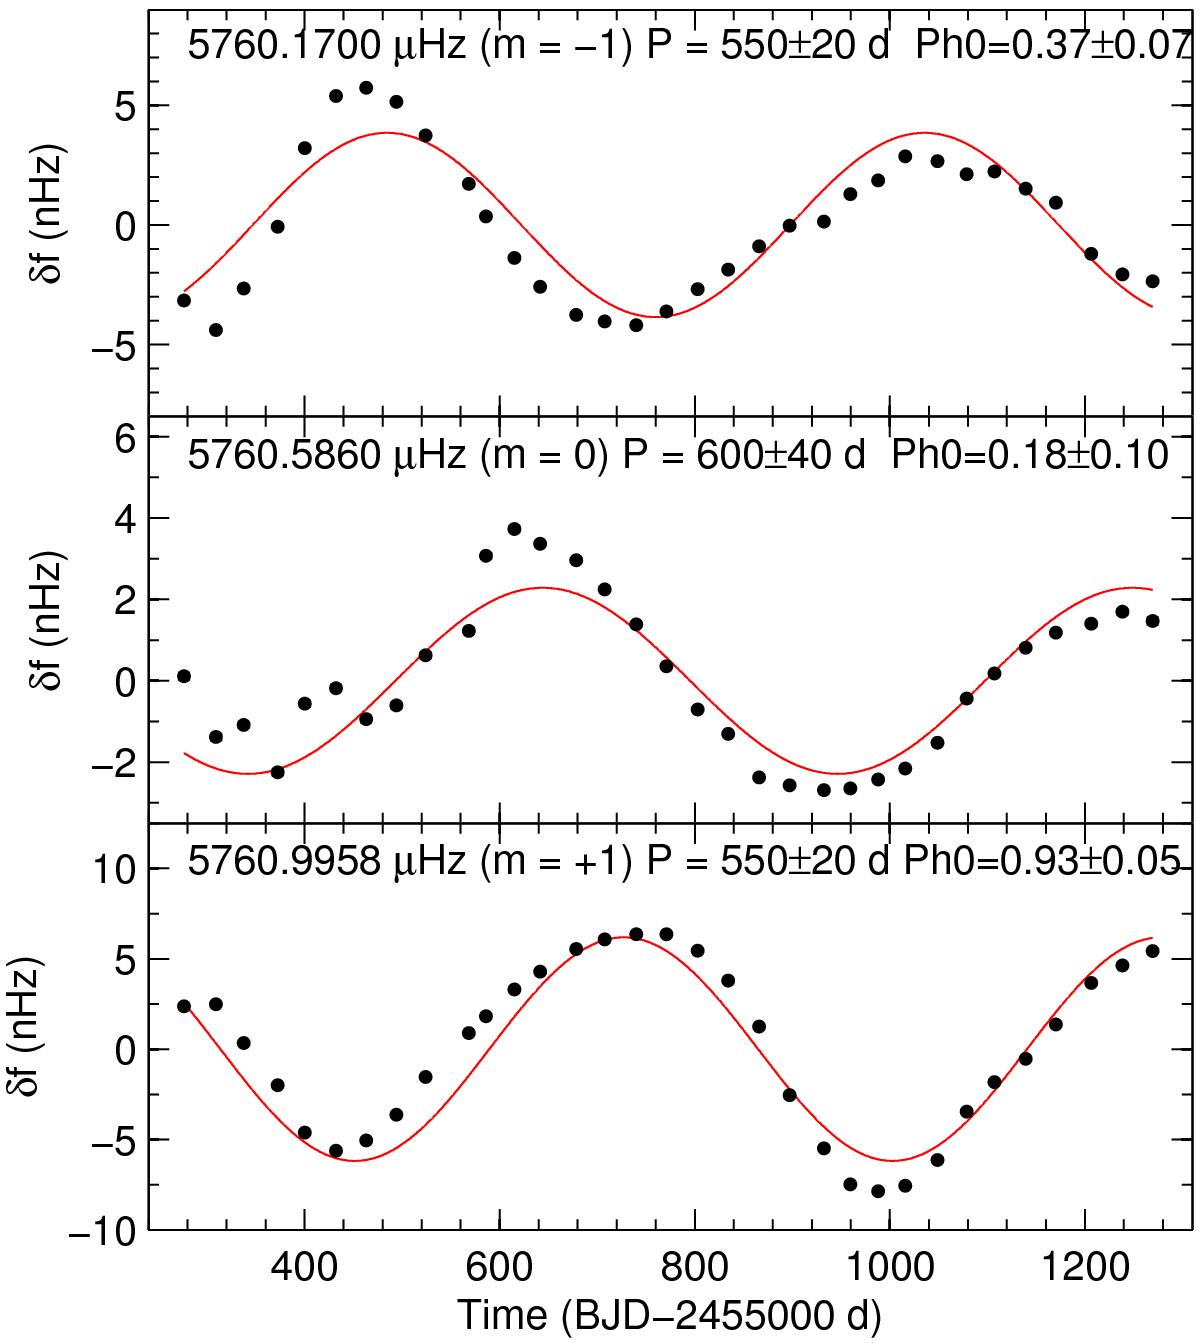
Frequency modulations after removing the long-term trend in the T1 triplet by applying a second-order polynomial fit. The solid curves represent the best fits of one pure sine wave to the frequency modulations. The associated formal errors for the periods and phases are also estimated.
Current usage metrics show cumulative count of Article Views (full-text article views including HTML views, PDF and ePub downloads, according to the available data) and Abstracts Views on Vision4Press platform.
Data correspond to usage on the plateform after 2015. The current usage metrics is available 48-96 hours after online publication and is updated daily on week days.
Initial download of the metrics may take a while.