Fig. 4
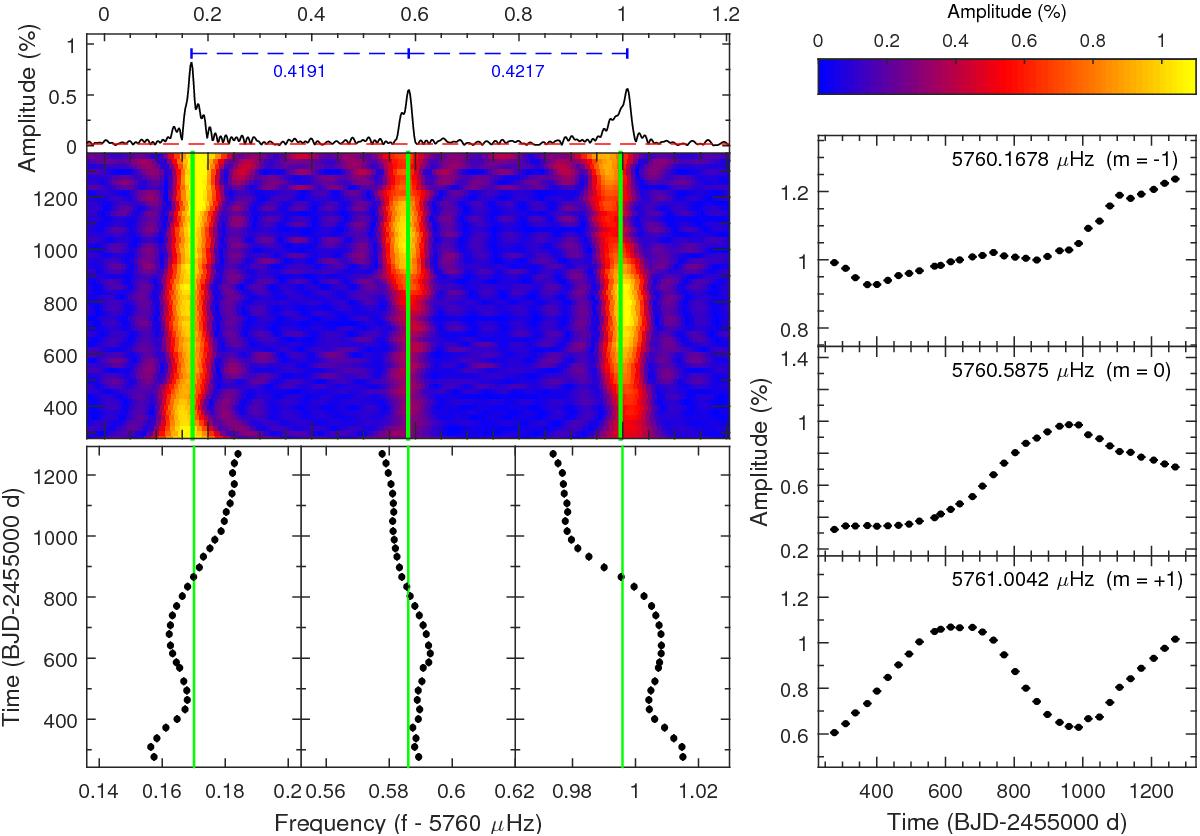
Frequency and amplitude modulations in the T1p-mode triplet near 5760 μHz. Top-left panel presents the fine structures of the well defined triplet with near symmetric frequency spacings. The dashed horizontal line in red represents the 5.6 σ detection threshold. Middle-left panel shows the sliding Lomb-Scargle periodogram (sLSP giving the amplitude in % as a function of frequency in μHz and time in days) of the triplet as a whole. Bottom-left panel shows expanded views around the average frequency (the solid vertical lines, also in the middle left panel) of each component, obtained from prewhitening subsets of the data, thus measuring precisely the frequencies, as a function of time. Right panel provides the measured amplitudes as a function of time obtained for each subset of data (see text for details). Note that the errors for each measurement is smaller than the symbol itself.
Current usage metrics show cumulative count of Article Views (full-text article views including HTML views, PDF and ePub downloads, according to the available data) and Abstracts Views on Vision4Press platform.
Data correspond to usage on the plateform after 2015. The current usage metrics is available 48-96 hours after online publication and is updated daily on week days.
Initial download of the metrics may take a while.