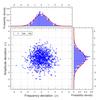
Fig. 3
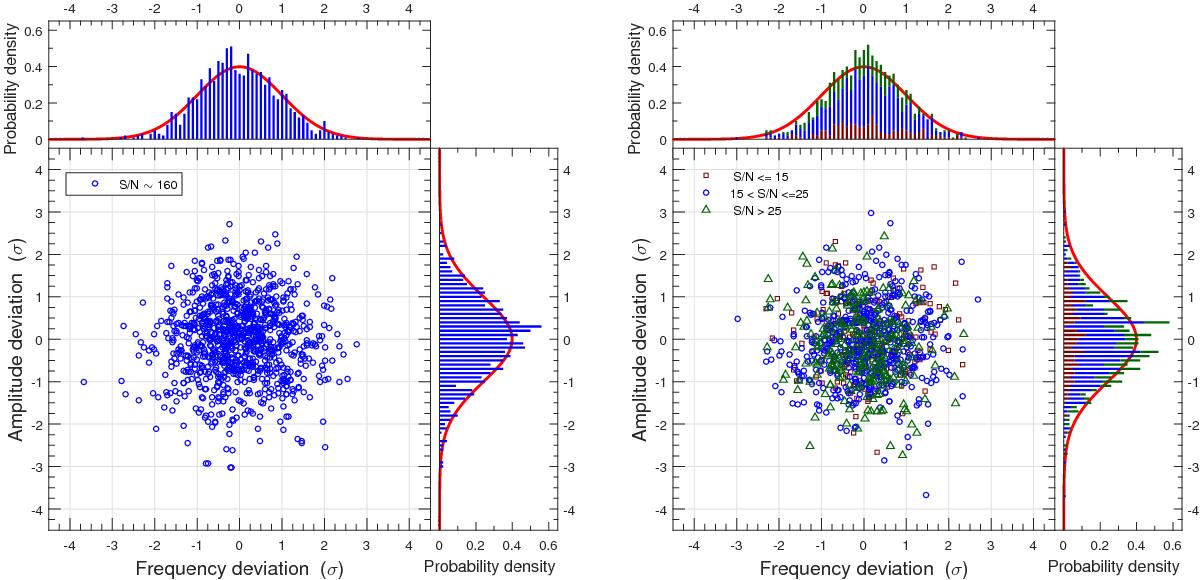
Left panel: 2D distribution of the frequency and amplitude deviations between the prewhitened and the injected values for 1000 artificial modes of constant amplitude. S/N denotes the signal-to-noise ratio of the injected signals and the deviations have been normalized by the 1σ error, σA and σf, derived from the prewhitening procedure implemented in the code Felix. The 2D distribution is also projected into 1D histograms (frequency and amplitude) to be compared with the Normal Distribution, ![]() plotted as a red solid curve. Right panel: same as above but for 1000 modes with random amplitudes. The injected modes are divided into three groups of S/N in the ranges [5,15], (15,25], and (25,60], respectively (represented by three different colors and symbols).
plotted as a red solid curve. Right panel: same as above but for 1000 modes with random amplitudes. The injected modes are divided into three groups of S/N in the ranges [5,15], (15,25], and (25,60], respectively (represented by three different colors and symbols).
Current usage metrics show cumulative count of Article Views (full-text article views including HTML views, PDF and ePub downloads, according to the available data) and Abstracts Views on Vision4Press platform.
Data correspond to usage on the plateform after 2015. The current usage metrics is available 48-96 hours after online publication and is updated daily on week days.
Initial download of the metrics may take a while.