Fig. 2
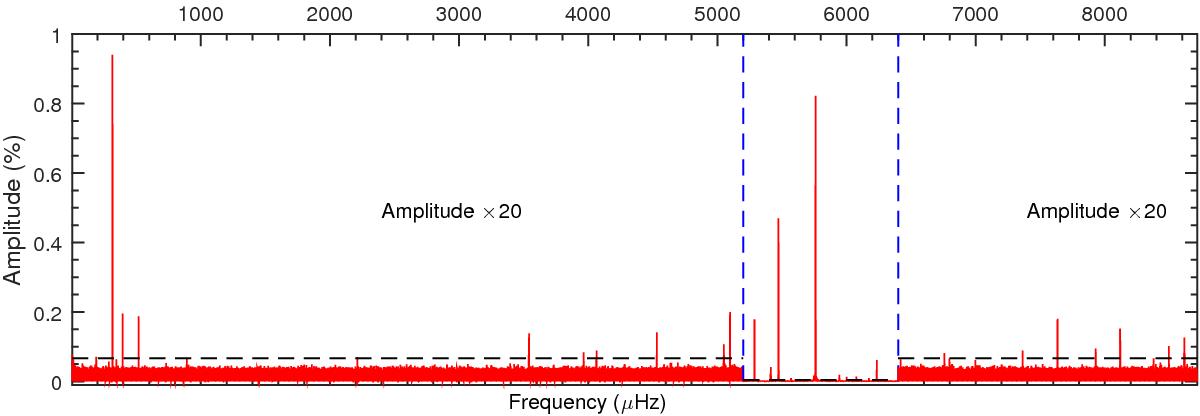
Lomb-Scargle periodogram (LSP; amplitude in % of the mean brightness vs frequency in μHz) of the Kepler light curve for KIC 10139564. The represented range, up to the Nyquist frequency, covers the long-period g-mode and the short-period p-mode frequency domains. The region between the two dashed vertical lines at 5200 and 6400 μHz is where peaks have the largest amplitudes. However, weaker peaks outside of this particular region are present and are made visible by scaling up amplitudes by a factor of 20. The dashed horizontal line represents the 5.6σ detection threshold (see text). Some well-known Kepler instrumental artefacts are present, but can easily be recognized.
Current usage metrics show cumulative count of Article Views (full-text article views including HTML views, PDF and ePub downloads, according to the available data) and Abstracts Views on Vision4Press platform.
Data correspond to usage on the plateform after 2015. The current usage metrics is available 48-96 hours after online publication and is updated daily on week days.
Initial download of the metrics may take a while.