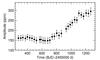
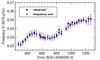
Fig. 13
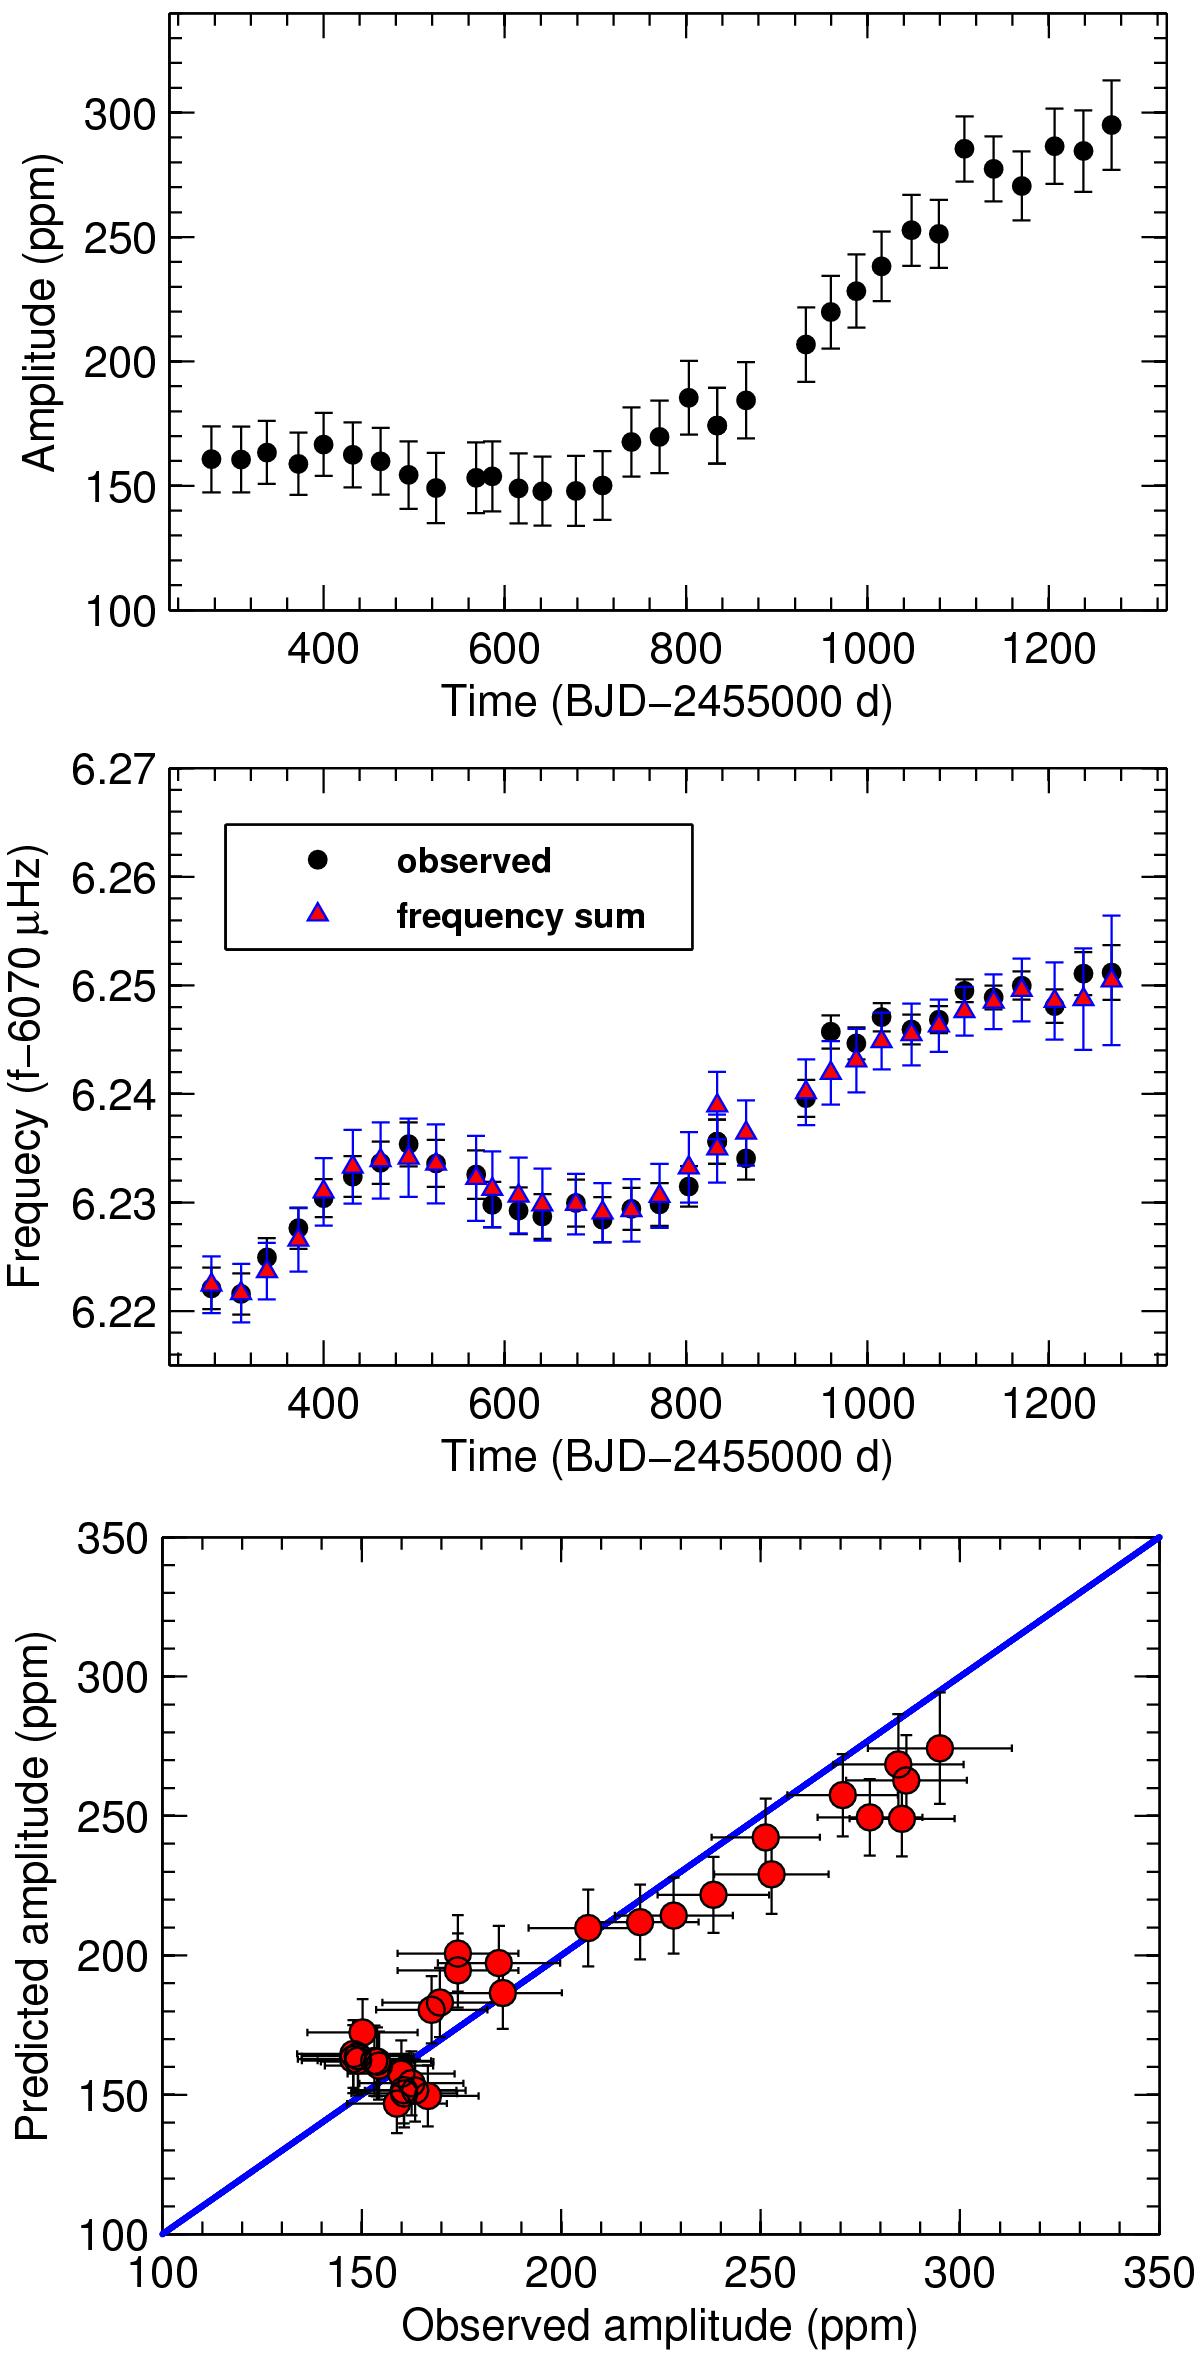
Amplitude and frequency variations of the linear combination frequency f23 = f1 + f11. Top panel: measured amplitudes as a function of time obtained from each data subset (using the same method as for multiplets). Middle panel: measured frequencies from each data subset compared with the frequency sum f1 + f11, both as a function of time. Bottom panel: observed amplitudes of f23 vs predicted amplitudes of R × the product of f1 and f11 amplitudes (see Eq. (6) for the definition of R). In both cases (frequency and amplitude comparisons), the measurements are found to be within 1σ.
Current usage metrics show cumulative count of Article Views (full-text article views including HTML views, PDF and ePub downloads, according to the available data) and Abstracts Views on Vision4Press platform.
Data correspond to usage on the plateform after 2015. The current usage metrics is available 48-96 hours after online publication and is updated daily on week days.
Initial download of the metrics may take a while.