Free Access
Fig. 12
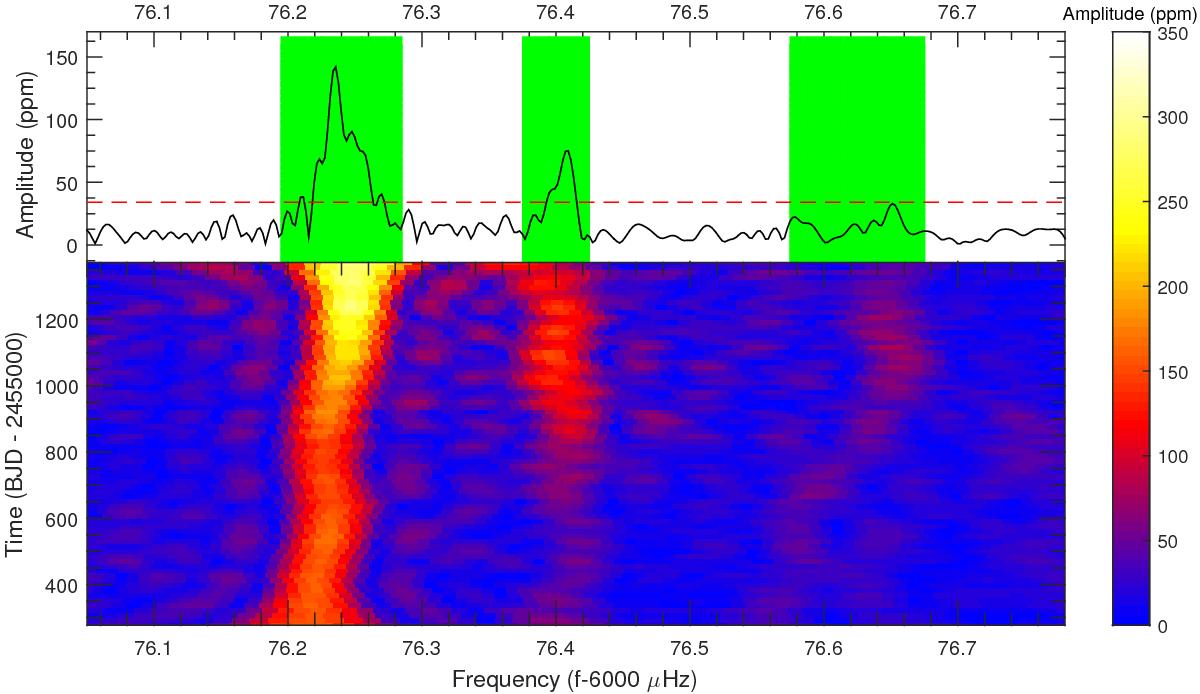
Frequency and amplitude modulations of a group of linear combination frequencies C1 near 6076 μHz. The red dashed line indicates the 5.6σ detection threshold. The green shadowed areas in top panel represent the scales of variation of these frequencies (see text for details).
Current usage metrics show cumulative count of Article Views (full-text article views including HTML views, PDF and ePub downloads, according to the available data) and Abstracts Views on Vision4Press platform.
Data correspond to usage on the plateform after 2015. The current usage metrics is available 48-96 hours after online publication and is updated daily on week days.
Initial download of the metrics may take a while.