Free Access
Fig. 3
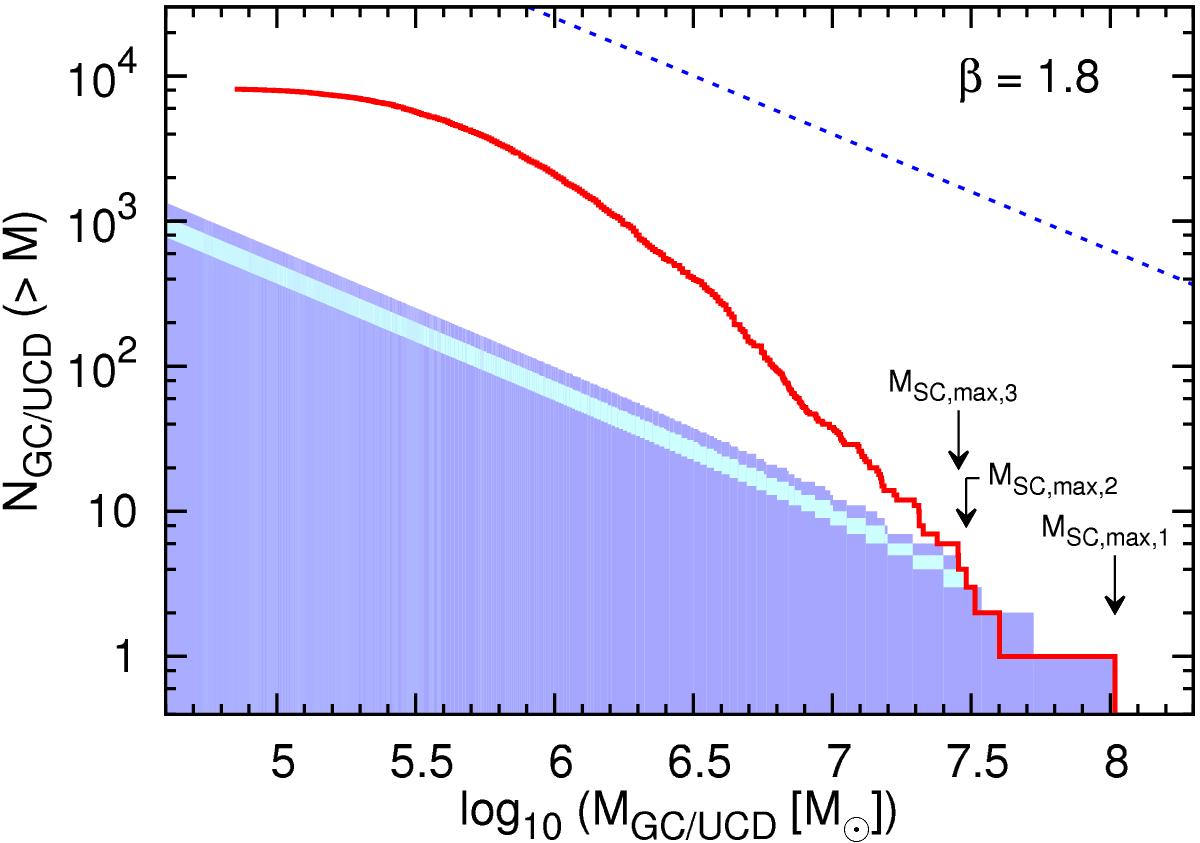
Decomposition of the observed GC/UCD cumulative mass distribution corrected for mass loss (see Sect. 5; red continuous line) into individual SC populations (colored areas). Here, the first three populations for an ECMF with β = 1.8 are shown. The most massive object of each population is indicated.
Current usage metrics show cumulative count of Article Views (full-text article views including HTML views, PDF and ePub downloads, according to the available data) and Abstracts Views on Vision4Press platform.
Data correspond to usage on the plateform after 2015. The current usage metrics is available 48-96 hours after online publication and is updated daily on week days.
Initial download of the metrics may take a while.