Fig. 1
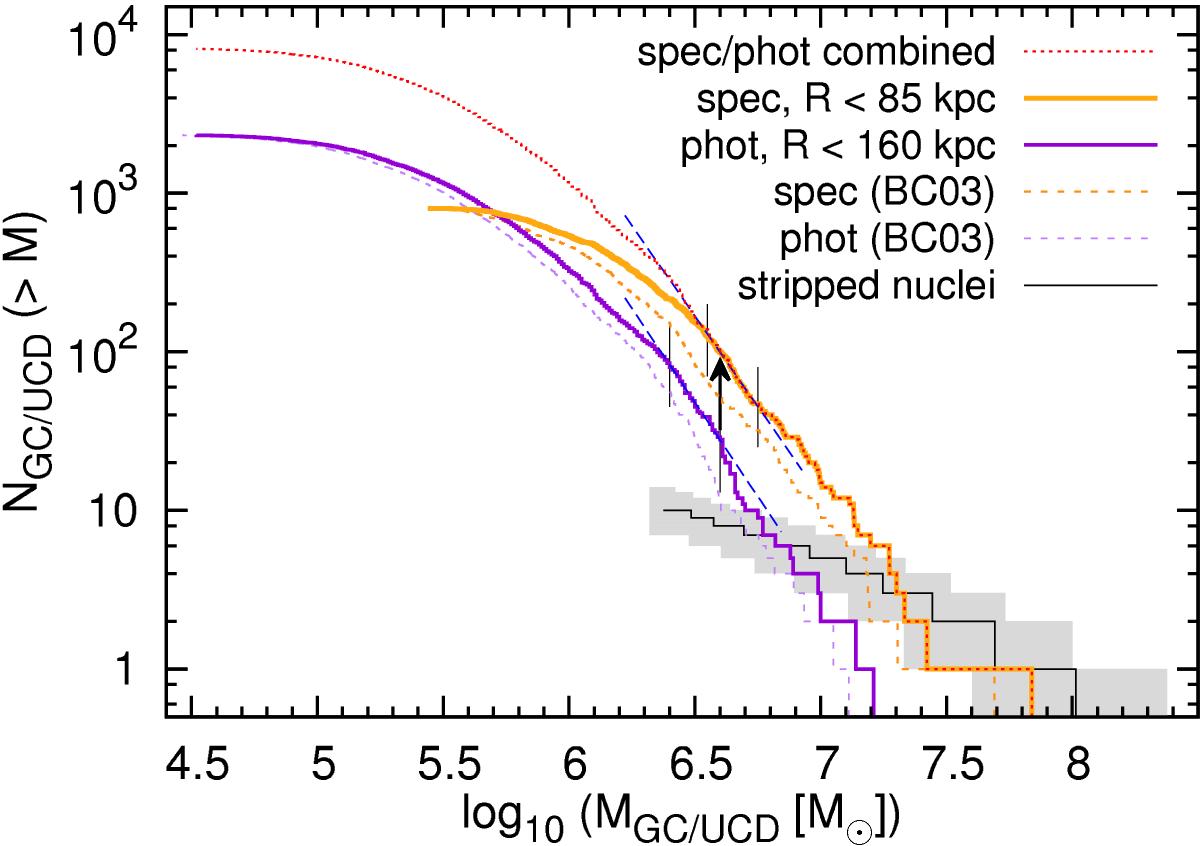
Cumulative mass function of the spectroscopic (orange continuous line, spec sample) and the photometric sample (purple continuous line, phot sample). In both cases, the masses were determined from SSP models by Maraston (2005). The scaling with the factor 3.5 was applied at log 10 (M/M⊙) = 6.6 (vertical arrow) where the slopes (dashed blue lines) of the cumulative functions are almost the same, resulting in the combined cumulative GC/UCD mass function (red dotted line). For comparison, the dashed thin orange and purple lines show the cumulative mass function of the spectroscopic and the photometric sample, respectively, where the masses have been calculated based on Bruzual & Charlot (2003). The black line represents the cumulative distribution of stripped nuclei as determined by Pfeffer et al. (2014), while the standard deviation area is colored in gray (see Sect. 6).
Current usage metrics show cumulative count of Article Views (full-text article views including HTML views, PDF and ePub downloads, according to the available data) and Abstracts Views on Vision4Press platform.
Data correspond to usage on the plateform after 2015. The current usage metrics is available 48-96 hours after online publication and is updated daily on week days.
Initial download of the metrics may take a while.