Fig. 8
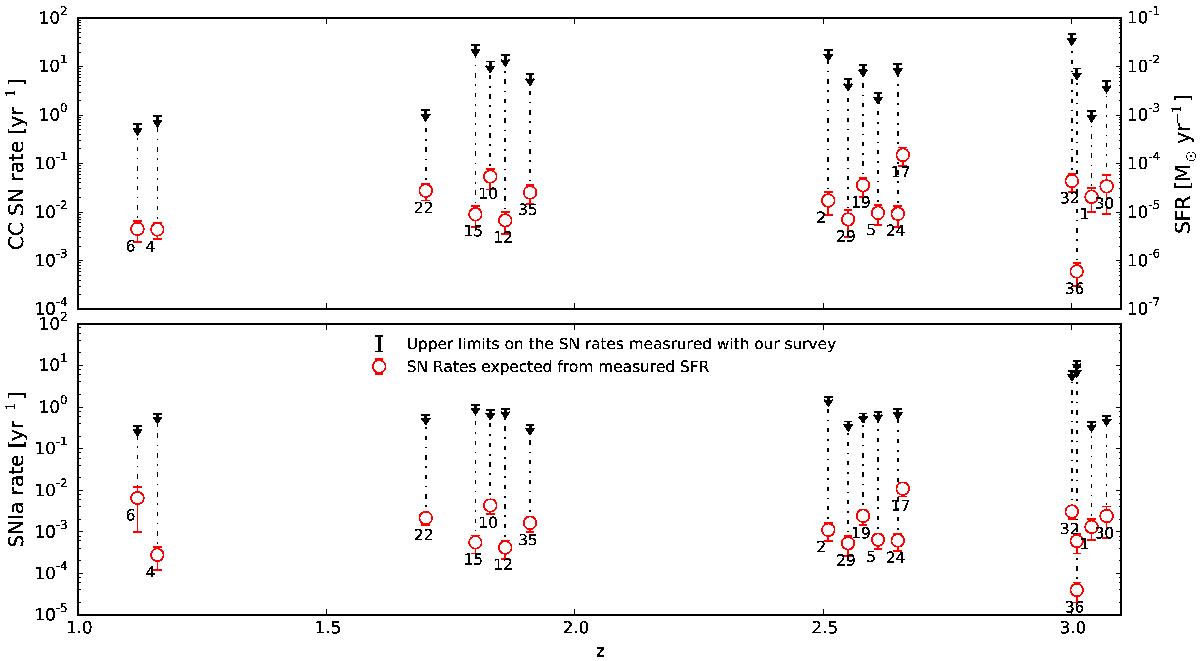
Comparison of the supernova rates limits measured from our survey and those obtained from the SFR published in Riehm et al. (2011). The limits represent 90% C.L. The numbers label the background galaxies shown in Fig. 9. Only the galaxies with multiple images and delay time less than five years (i.e. less than the duration of the survey) are considered here.
Current usage metrics show cumulative count of Article Views (full-text article views including HTML views, PDF and ePub downloads, according to the available data) and Abstracts Views on Vision4Press platform.
Data correspond to usage on the plateform after 2015. The current usage metrics is available 48-96 hours after online publication and is updated daily on week days.
Initial download of the metrics may take a while.