Free Access
Fig. 6
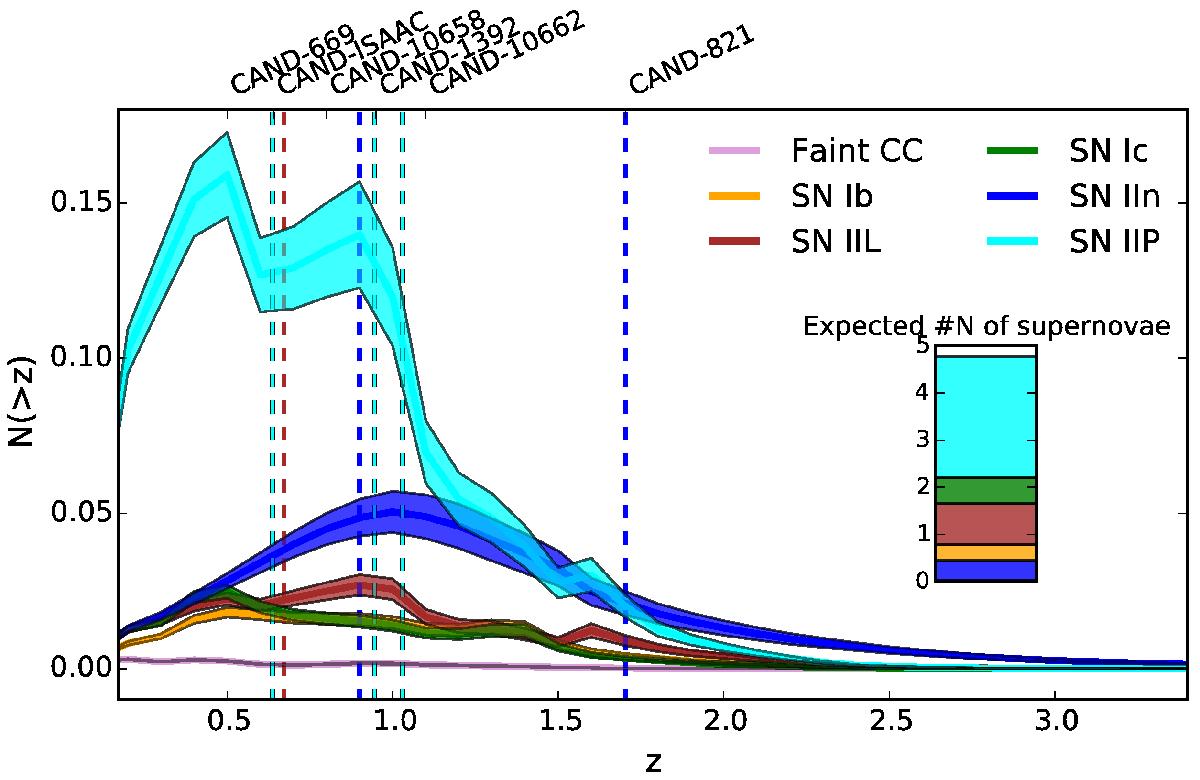
Redshift distribution of core-collapse supernova discoveries expected from the surveys with a rate model from Mannucci et al. (2007). The redshift of the core-collapse supernova candidates from our surveys are indicated with dashed line. The total expected number of core-collapse supernovae is also shown.
Current usage metrics show cumulative count of Article Views (full-text article views including HTML views, PDF and ePub downloads, according to the available data) and Abstracts Views on Vision4Press platform.
Data correspond to usage on the plateform after 2015. The current usage metrics is available 48-96 hours after online publication and is updated daily on week days.
Initial download of the metrics may take a while.