Fig. 10
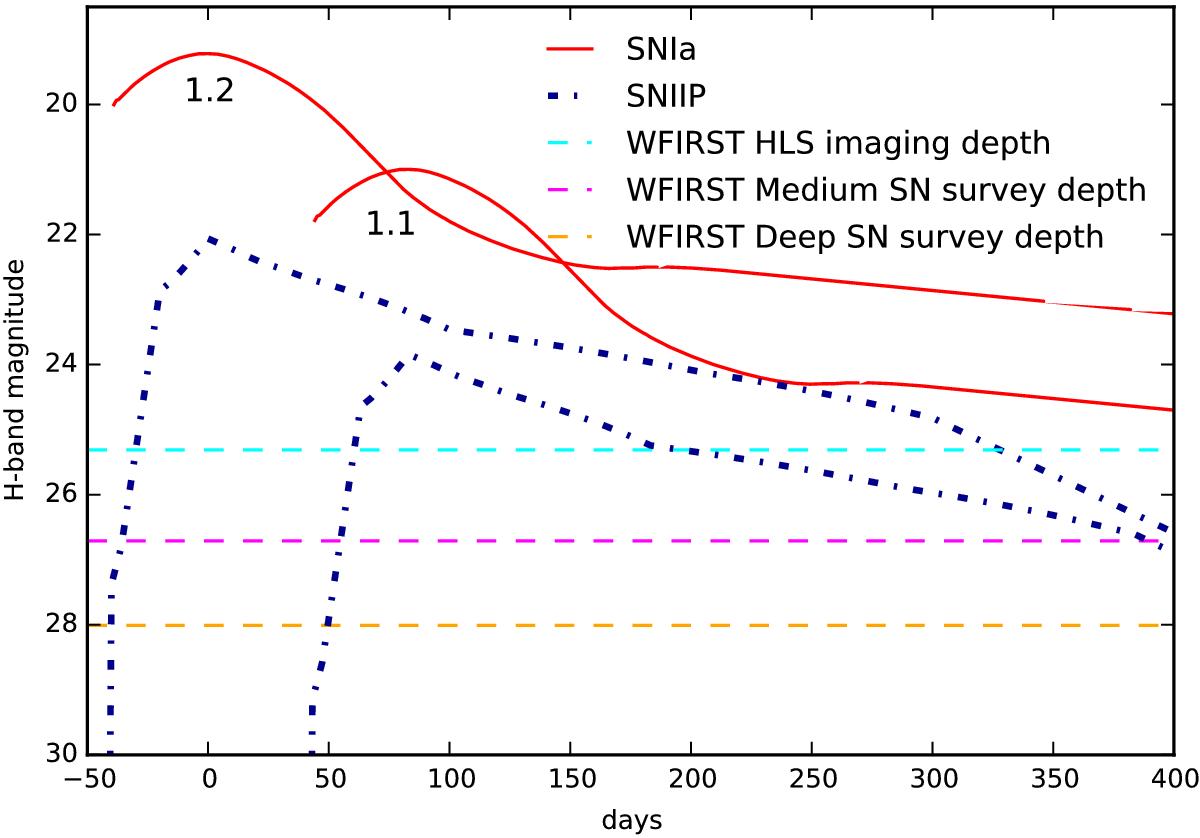
Simulated light curves for SN Ia and IIP in the H band for the multiply-imaged system 1 at z = 3.04; images 1.1 and 1.2 are magnified ![]() and
and ![]() mag, respectively. The time delay between the images is
mag, respectively. The time delay between the images is ![]() days (Riehm et al. 2011). Also shown are the magnitude limits for the three main survey modes planned for WFIRST (Spergel et al. 2013). Without the magnification from A 1689, the SN IIP would hardly be observable.
days (Riehm et al. 2011). Also shown are the magnitude limits for the three main survey modes planned for WFIRST (Spergel et al. 2013). Without the magnification from A 1689, the SN IIP would hardly be observable.
Current usage metrics show cumulative count of Article Views (full-text article views including HTML views, PDF and ePub downloads, according to the available data) and Abstracts Views on Vision4Press platform.
Data correspond to usage on the plateform after 2015. The current usage metrics is available 48-96 hours after online publication and is updated daily on week days.
Initial download of the metrics may take a while.