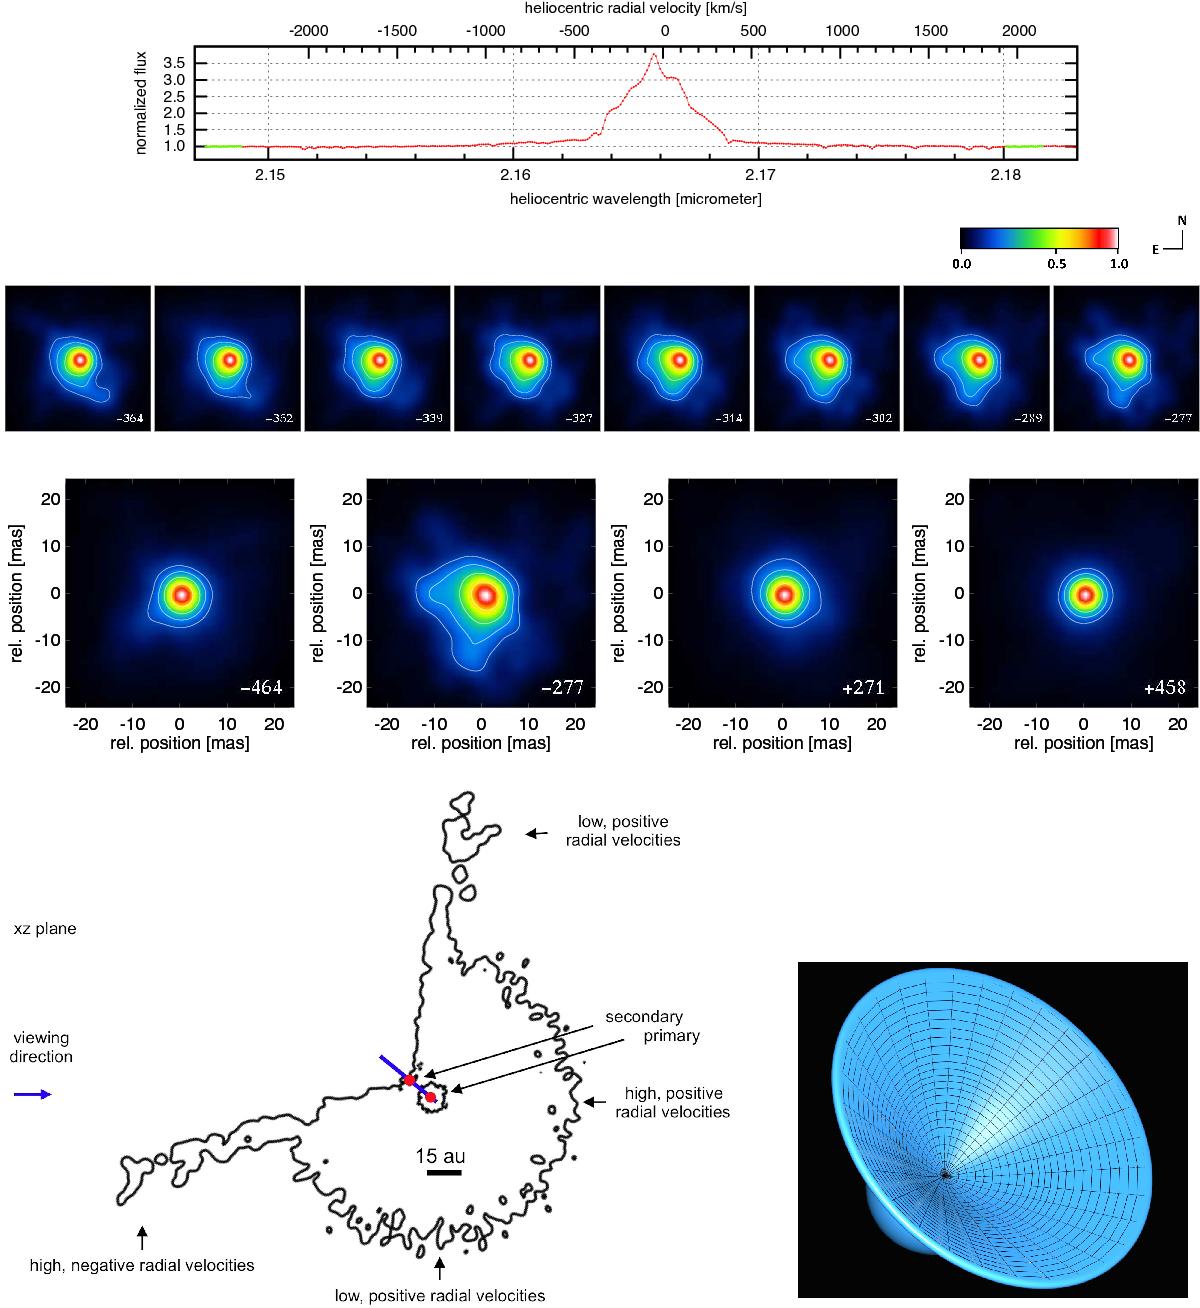
Fig. 6

Comparison of η Car images with model density distributions. Top: continuum-normalized Brγ line profile (same as in Fig. 4). Second row: SW bar structure at velocities of −364 to − 352 km s-1 and fan-shaped SE structure at velocities of about −339 to − 277 km s-1 (images from Fig. 4; the FOV is 50 × 50 mas or 118 × 118 au; 1 mas corresponds to 2.35 au; north is up, and east is to the left). Contour lines are plotted at 8, 16, 32, and 64% of the peak intensity. The fan-shaped SE structures suggest that the reconstructed images are direct images of the wind-wind collision zone. Third row: from left to right, images at velocities of − 464 km s-1 (continuum), − 277 km s-1 (fan-shaped SE extension), +271 km s-1, and +458 km s-1 (continuum). At velocity of − 277 km s-1, the image is asymmetric, fan-shaped, and more extended than the image at velocity of +271 km s-1. Bottom left: illustration of the V-shaped wind-wind collision model, our viewing direction at the time of observation, and the radial velocities seen by the observer. The iso-density contours are extracted from the model presented in Fig. B1 (phase 0.90) in Madura et al. (2013). Two density contours (10-16 g cm-3 and 10-14 g cm-3) of the model density distribution are shown. The binary orbit (semimajor axis length ~15.45 au) is sketched as a blue line. The projected elliptical orbit is a line in the shown plane perpendicular to the orbital plane (Madura et al. 2012, 2013). The two red dots mark the positions of the primary and secondary star at the time of observation (binary separation ~ 4.9 mas or 11.5 au; see Sect. 4). Bottom right: line-of-sight view of a three-dimensional iso-density surface (density 10-16 g cm-3) of the wind at the time of observation (north is up, and east is to the left; FOV is ~50 × 50 mas). This iso-density distribution is a smoothed version of model iso-density derived by Madura et al. (2013). A small part of the Brγ primary wind is visible to the SE. The continuum primary wind is not visible because its diameter is smaller than the Brγ primary wind. The binary separation and PA were approximately 4.9 mas (11.5 au) and 315°, respectively, at the time of observation. The secondary star is not visible in the images, because it is at least about 100 times fainter than the primary star, which is also not visible due to high extinction.
Current usage metrics show cumulative count of Article Views (full-text article views including HTML views, PDF and ePub downloads, according to the available data) and Abstracts Views on Vision4Press platform.
Data correspond to usage on the plateform after 2015. The current usage metrics is available 48-96 hours after online publication and is updated daily on week days.
Initial download of the metrics may take a while.


