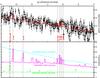
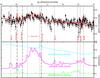
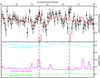
Fig. 6
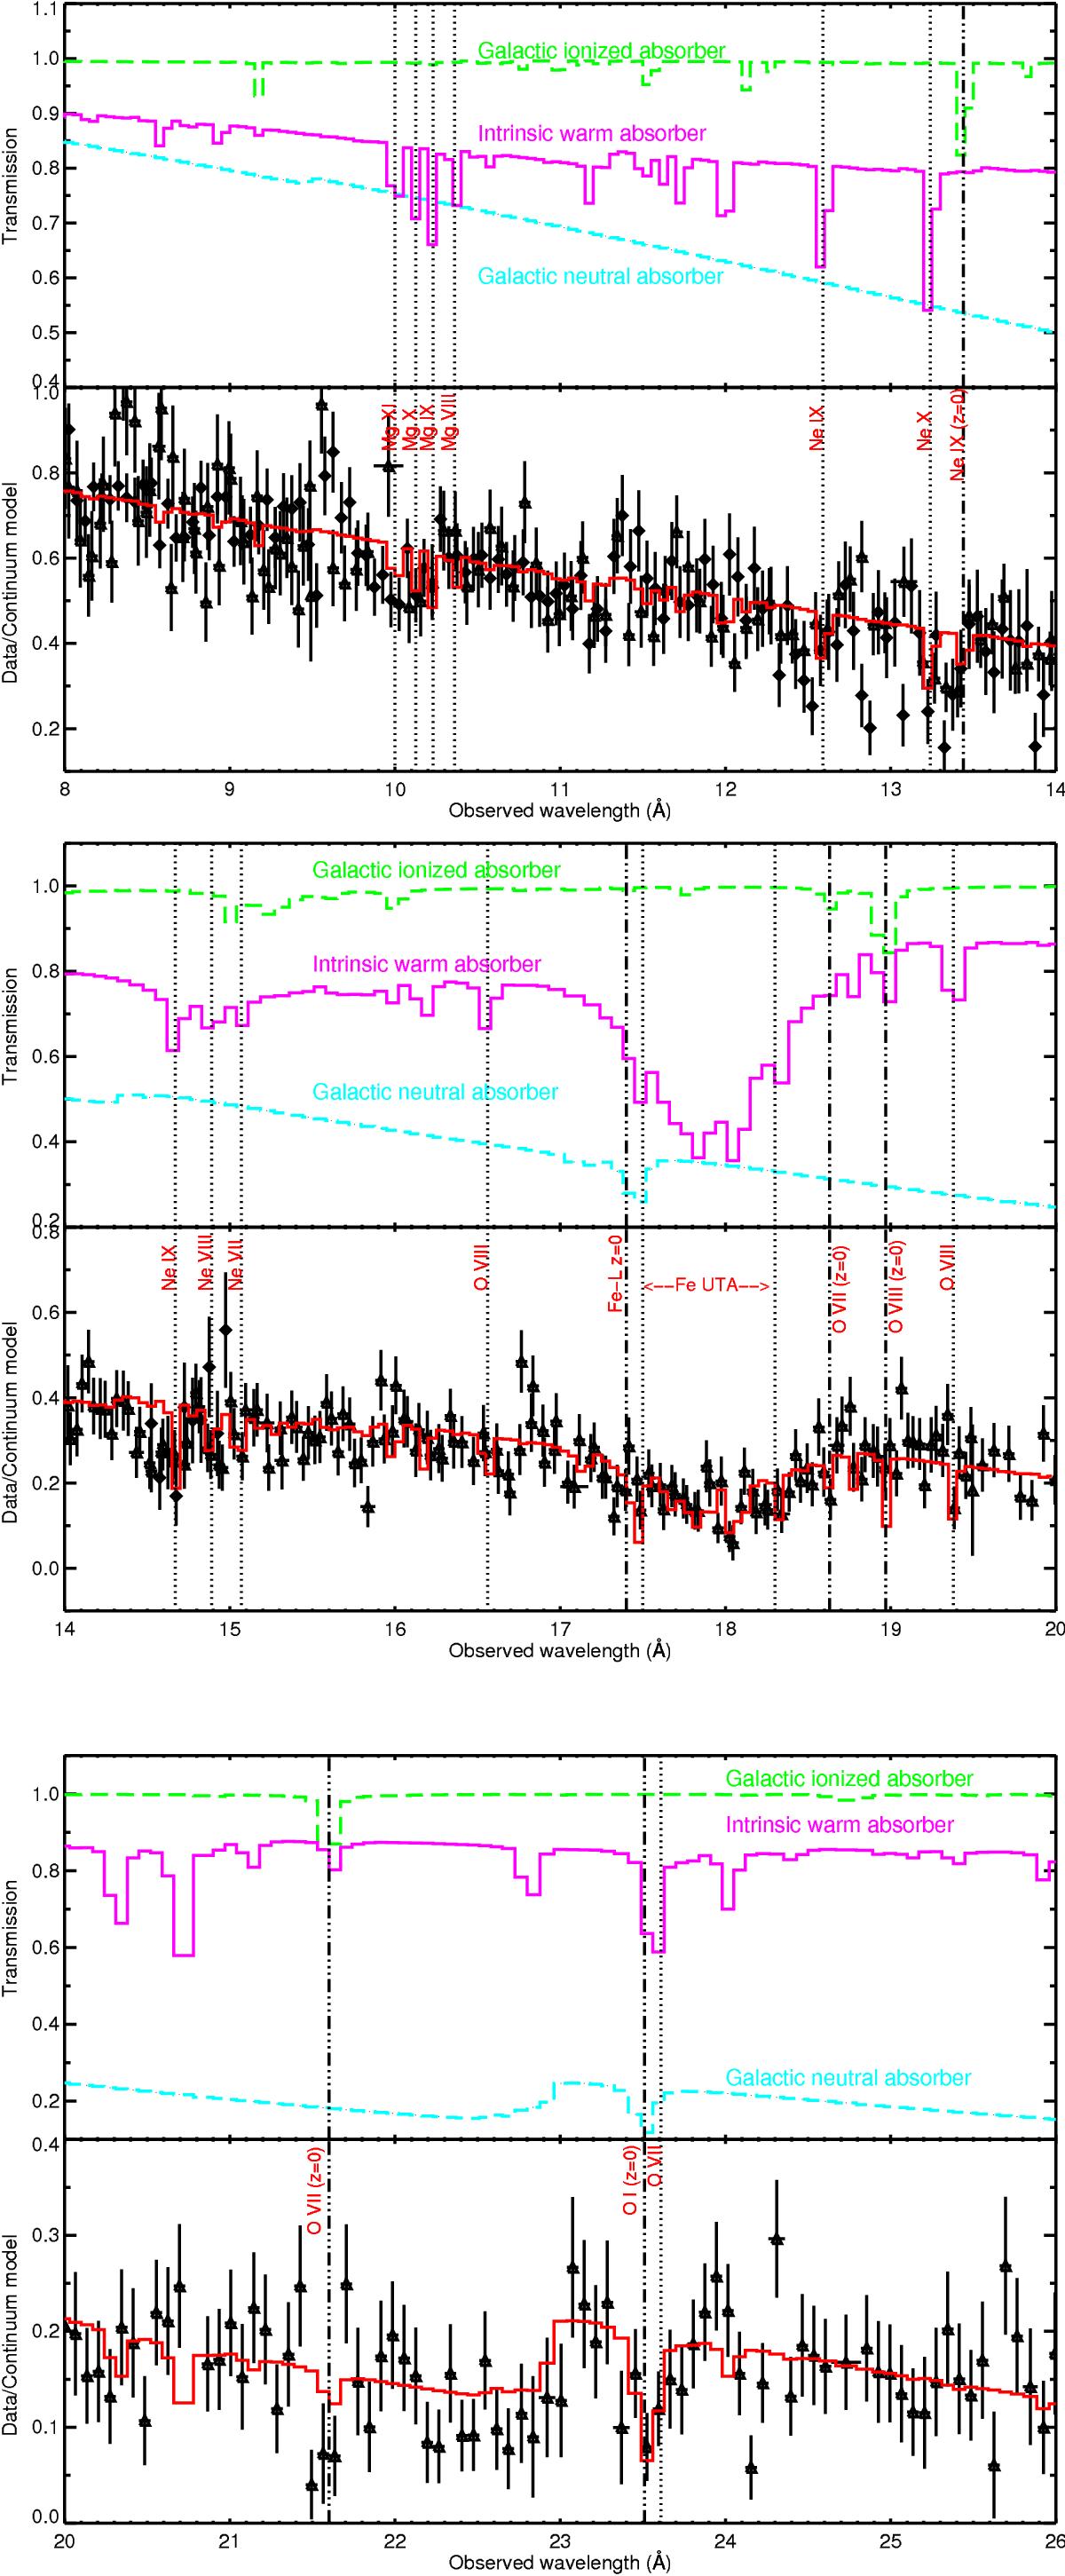
From top to bottom: absorption features of 4C +74.26 in the 8–14 Å (upper figure), 14–20 Å (middle figure), and 20–26 Å band (lower figure). In each figure the transmission (upper panel) of the Galactic (long-dashed lines) and intrinsic (solid line) absorbing components is shown together with the ratio between the data and the continuum model (lower panel), highlighting the absorption features. The HETGS and the RGS data points are plotted as diamonds and triangles, respectively. The solid line represent the best fit model. Vertical lines mark the position of the most prominent Galactic (double-dot-dashed lines) and intrinsic (dotted lines) absorption features.
Current usage metrics show cumulative count of Article Views (full-text article views including HTML views, PDF and ePub downloads, according to the available data) and Abstracts Views on Vision4Press platform.
Data correspond to usage on the plateform after 2015. The current usage metrics is available 48-96 hours after online publication and is updated daily on week days.
Initial download of the metrics may take a while.