Fig. 4
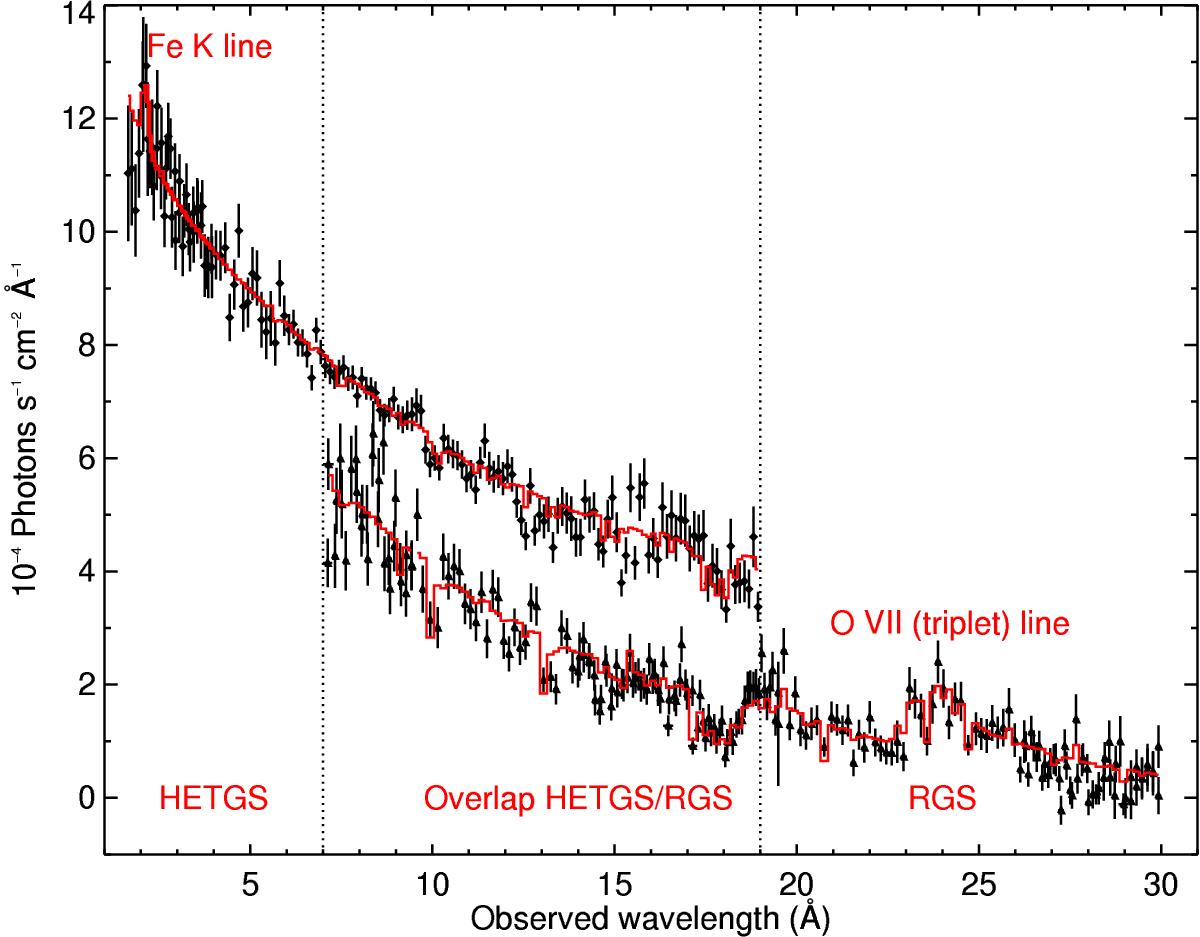
Best fit of the RGS and of the HETGS spectrum of 4C +74.26. The diamonds and the triangles indicate the HETGS and the RGS data points, respectively. The HETGS spectrum has been shifted upwards (× 3) for display purpose. Vertical lines indicate the band where the instruments overlap. The solid lines represent our best fit models. Emission lines are labeled. The spectra have been rebinned for clarity.
Current usage metrics show cumulative count of Article Views (full-text article views including HTML views, PDF and ePub downloads, according to the available data) and Abstracts Views on Vision4Press platform.
Data correspond to usage on the plateform after 2015. The current usage metrics is available 48-96 hours after online publication and is updated daily on week days.
Initial download of the metrics may take a while.