Free Access
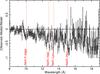
Fig. 2
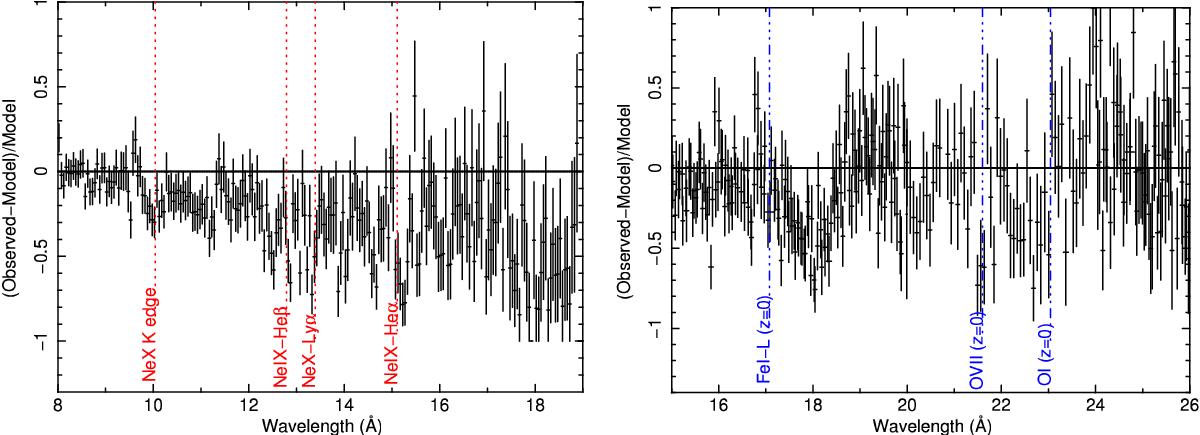
Relative residuals of the MEG (left panel) and the RGS (right panel) spectrum after a simple power-law fit. Vertical lines indicate the wavelengths of the Galactic (triple-dot-dashed line) and intrinsic (dashed line) candidate absorption lines and edges. The spectra have been rebinned for clarity.
This figure is made of several images, please see below:
Current usage metrics show cumulative count of Article Views (full-text article views including HTML views, PDF and ePub downloads, according to the available data) and Abstracts Views on Vision4Press platform.
Data correspond to usage on the plateform after 2015. The current usage metrics is available 48-96 hours after online publication and is updated daily on week days.
Initial download of the metrics may take a while.