Free Access
Fig. 6
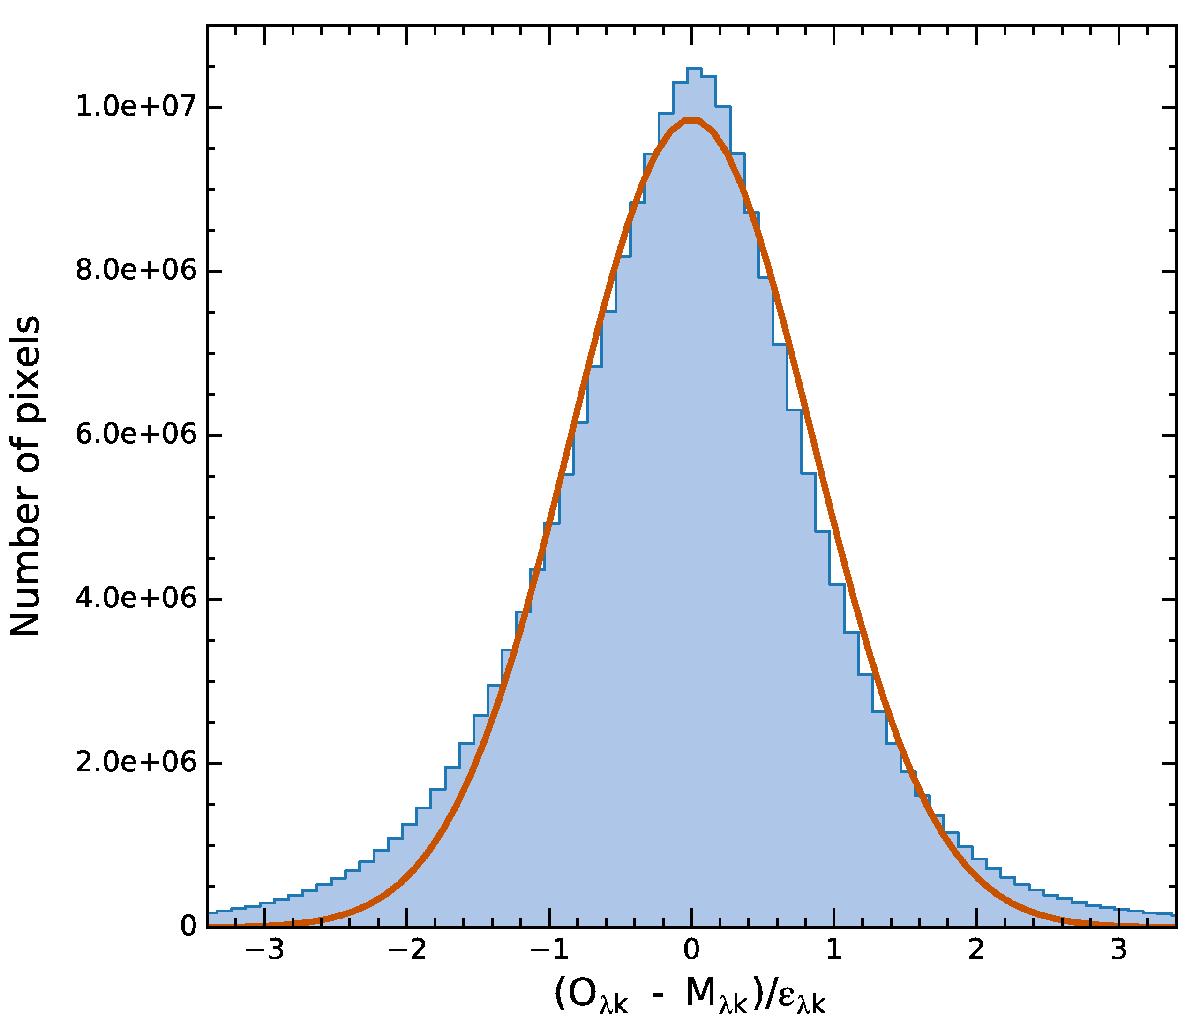
Histogram of the reduced residuals (Oλ,k−Mλ,k) /ϵλ,k for all wavelengths, all bins (k) and all galaxies in DR3 (433400381 points in total). The orange line shows the best Gaussian fit to the sample.
Current usage metrics show cumulative count of Article Views (full-text article views including HTML views, PDF and ePub downloads, according to the available data) and Abstracts Views on Vision4Press platform.
Data correspond to usage on the plateform after 2015. The current usage metrics is available 48-96 hours after online publication and is updated daily on week days.
Initial download of the metrics may take a while.