Free Access
Fig. 11
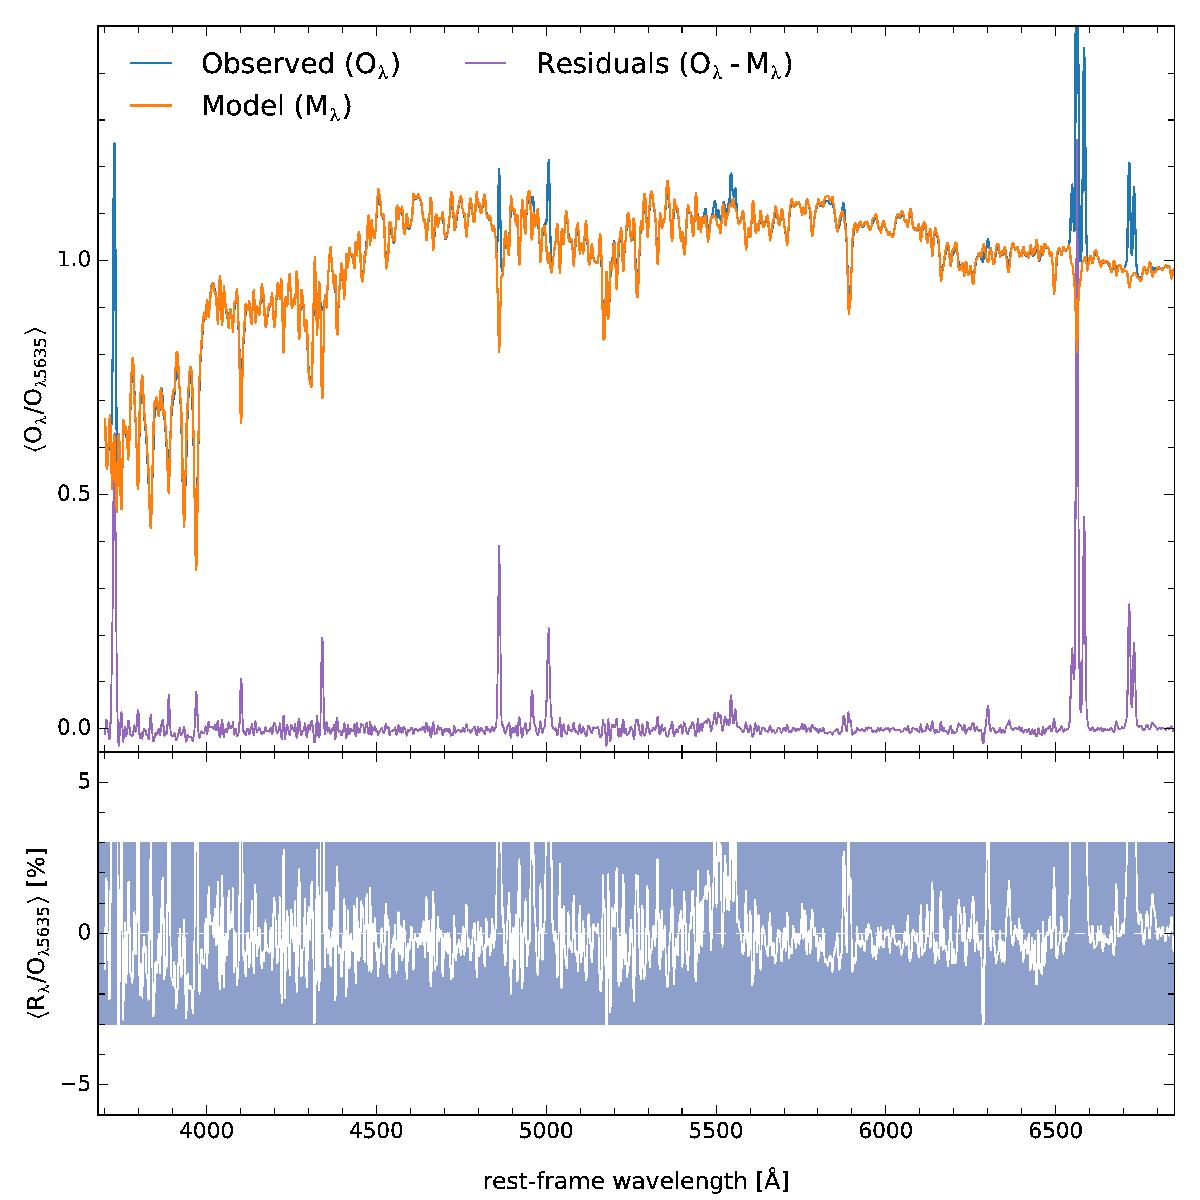
Statistics of the spectral residuals. Top panel: the mean normalized spectrum of 251313 bins from 446 galaxies. The mean Pipe3D fit is overplotted in orange, while the mean residual is plotted at the bottom of the panel (purple). Bottom panel: zoom of the residual spectrum. The shaded rectangle encompasses the ±3% area.
Current usage metrics show cumulative count of Article Views (full-text article views including HTML views, PDF and ePub downloads, according to the available data) and Abstracts Views on Vision4Press platform.
Data correspond to usage on the plateform after 2015. The current usage metrics is available 48-96 hours after online publication and is updated daily on week days.
Initial download of the metrics may take a while.