Fig. 10
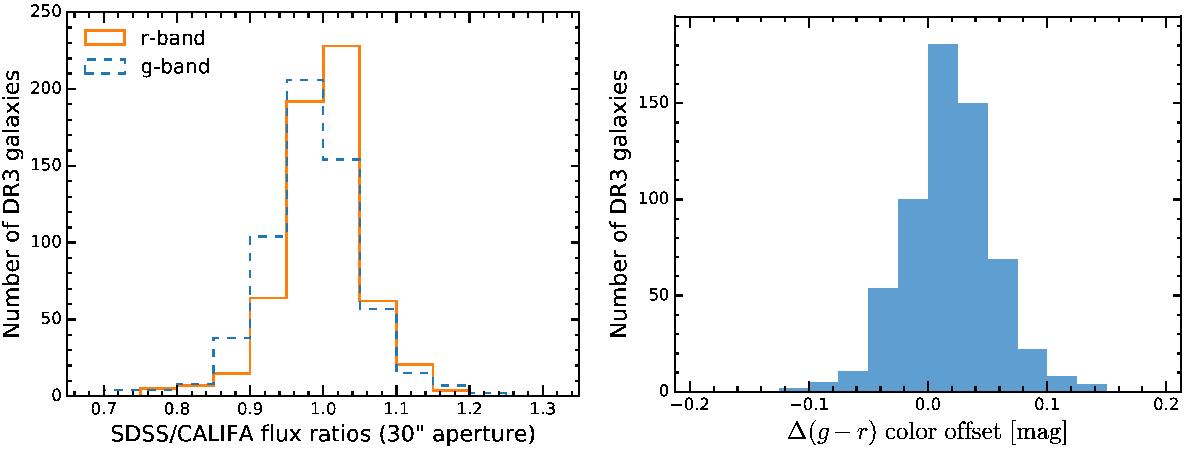
Left panel: distribution of the 30′′ aperture photometry scale factor between the SDSS DR7 images and recalibrated CALIFA data. We compare the photometry only for the g- and r-bands, which are both entirely covered by the V500 wavelength range. Right panel: distribution of the corresponding color offset between the SDSS DR7 images and the synthetic CALIFA broadband images.
Current usage metrics show cumulative count of Article Views (full-text article views including HTML views, PDF and ePub downloads, according to the available data) and Abstracts Views on Vision4Press platform.
Data correspond to usage on the plateform after 2015. The current usage metrics is available 48-96 hours after online publication and is updated daily on week days.
Initial download of the metrics may take a while.