Free Access
Fig. 1
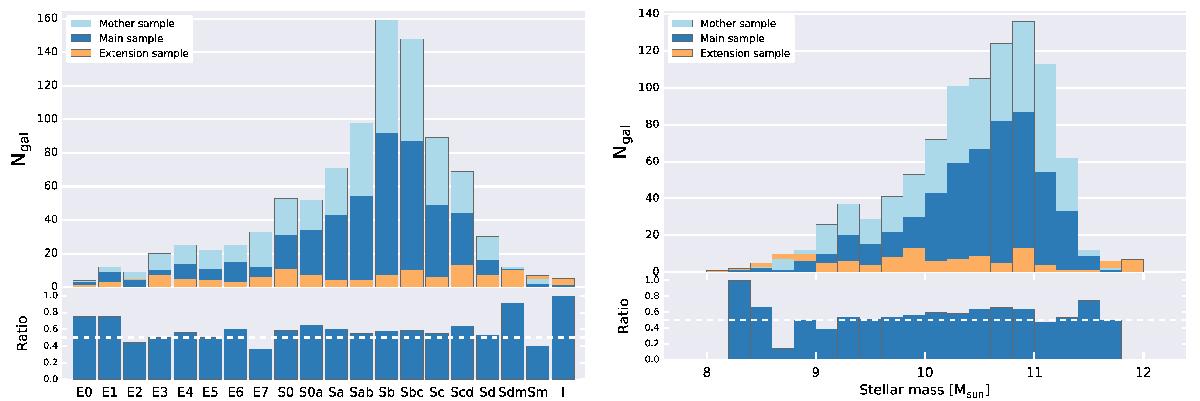
Left panel: histograms of visual morphological classification in the DR3 samples. Right panel: stellar mass histogram. The lower portion of each panel shows the ratio between the main sample and the mother sample.
This figure is made of several images, please see below:
Current usage metrics show cumulative count of Article Views (full-text article views including HTML views, PDF and ePub downloads, according to the available data) and Abstracts Views on Vision4Press platform.
Data correspond to usage on the plateform after 2015. The current usage metrics is available 48-96 hours after online publication and is updated daily on week days.
Initial download of the metrics may take a while.