Fig. 5
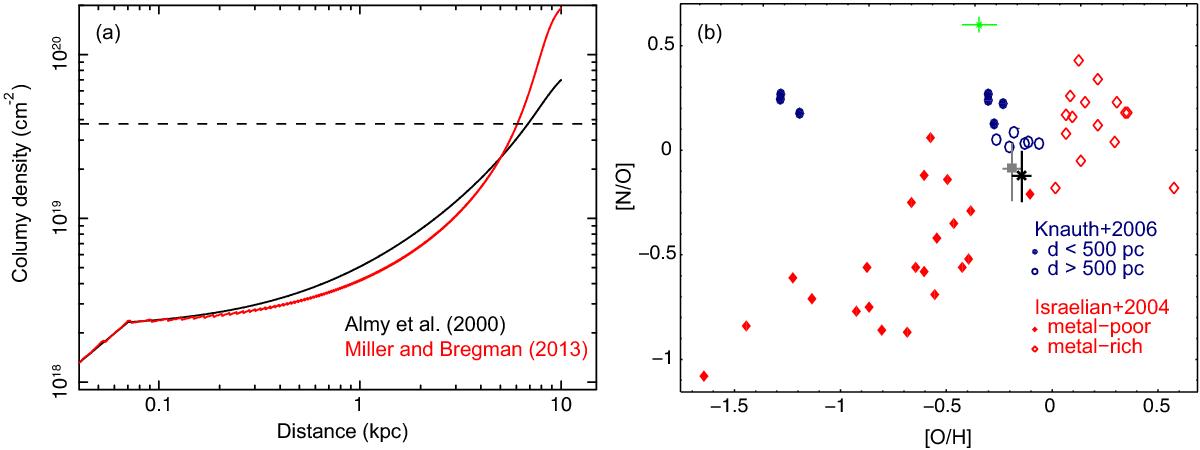
a) Integrated Earth-centered ISM column density profiles based on the models reported in Almy et al. (2000, black) and Miller & Bregman (2013, red). An additional column density from the local hot bubble is included in the central 70 pc. The dashed line shows the observed value based on the CIE model with ionized absorption. b) The [N/O] versus [O/H] diagram. The best-fit NPS results obtained with CIE and CIE plus CX models with the new absorptions are shown with black and gray error bars, respectively. The M08 result is plotted in green. The abundance patterns of the cold ISM based on local star and distant star absorption measurements by Knauth et al. (2006) are plotted as blue filled circles and blue empty circles, respectively. The metal-poor and metal-rich Galactic halo star data from Israelian et al. (2004) are indicated by red filled and red empty diamonds, respectively.
Current usage metrics show cumulative count of Article Views (full-text article views including HTML views, PDF and ePub downloads, according to the available data) and Abstracts Views on Vision4Press platform.
Data correspond to usage on the plateform after 2015. The current usage metrics is available 48-96 hours after online publication and is updated daily on week days.
Initial download of the metrics may take a while.