Fig. 4
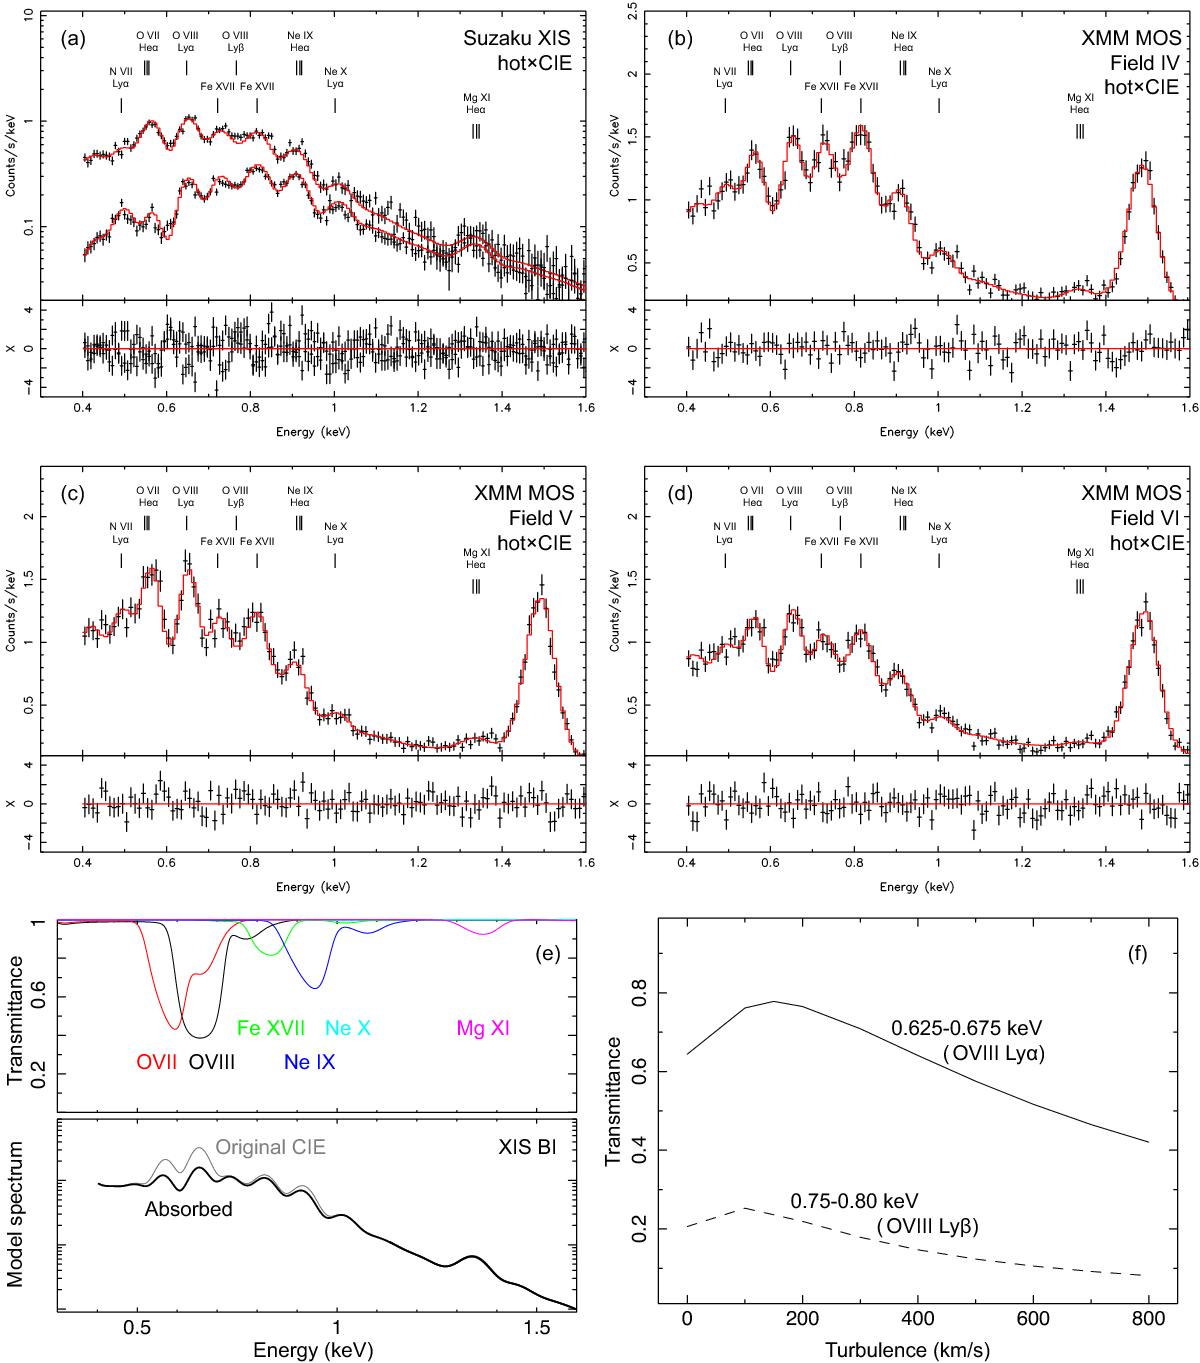
Same as Fig. 1, but the best-fit models are one CIE component subject to both neutral and ionized absorptions (a)−(d)). Panel e) shows the best-fit O vii, O viii, Fe xvii, Ne ix, Ne x, and Mg xi transmittances (upper), and the best-fit CIE emission absorbed by the ionized particles (lower). The model is convolved with the Suzaku XIS1 response. Panel f) plots the effective transmittances in the near-O viii Lyα (0.625−0.675 keV; solid line) and near-O viii Lyβ (0.75−0.80 keV; dashed line) bands as a function of turbulent velocity.
Current usage metrics show cumulative count of Article Views (full-text article views including HTML views, PDF and ePub downloads, according to the available data) and Abstracts Views on Vision4Press platform.
Data correspond to usage on the plateform after 2015. The current usage metrics is available 48-96 hours after online publication and is updated daily on week days.
Initial download of the metrics may take a while.