Fig. 3
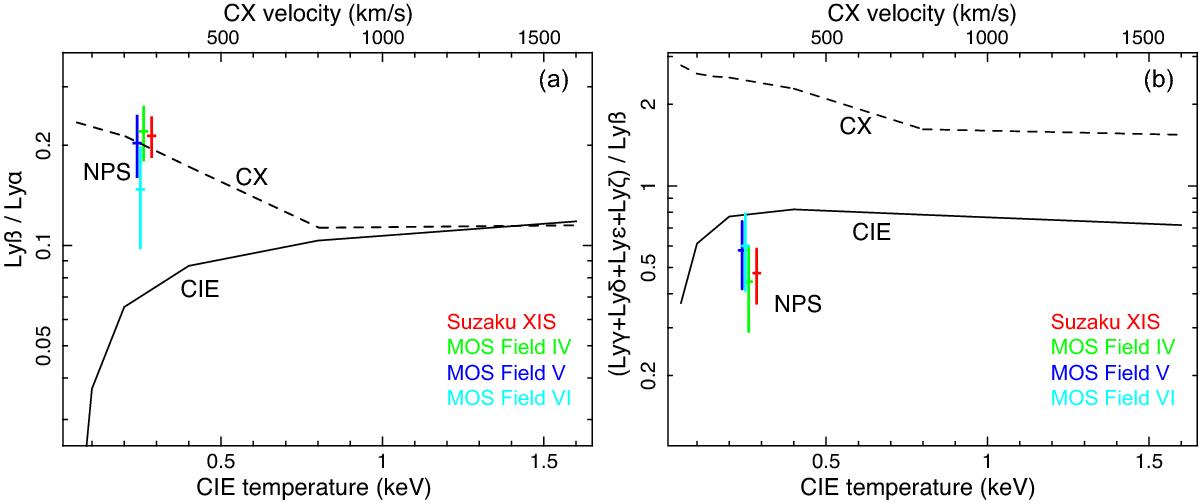
a) Observed O viii Lyβ/Lyα ratios obtained with the XIS (red), the MOS field IV (green), field V (blue), and field VI (cyan) plotted against the best-fit temperatures. The solid line is the Lyβ/Lyα versus temperature curve calculated by the CIE model, and the dashed line shows the Lyβ/Lyα versus collision velocity by the CX model. b) Same as panel a), but for the O viii (Lyγ + Lyδ + Lyϵ + Lyζ)/Lyβ ratio.
Current usage metrics show cumulative count of Article Views (full-text article views including HTML views, PDF and ePub downloads, according to the available data) and Abstracts Views on Vision4Press platform.
Data correspond to usage on the plateform after 2015. The current usage metrics is available 48-96 hours after online publication and is updated daily on week days.
Initial download of the metrics may take a while.