Fig. 6
Download original image
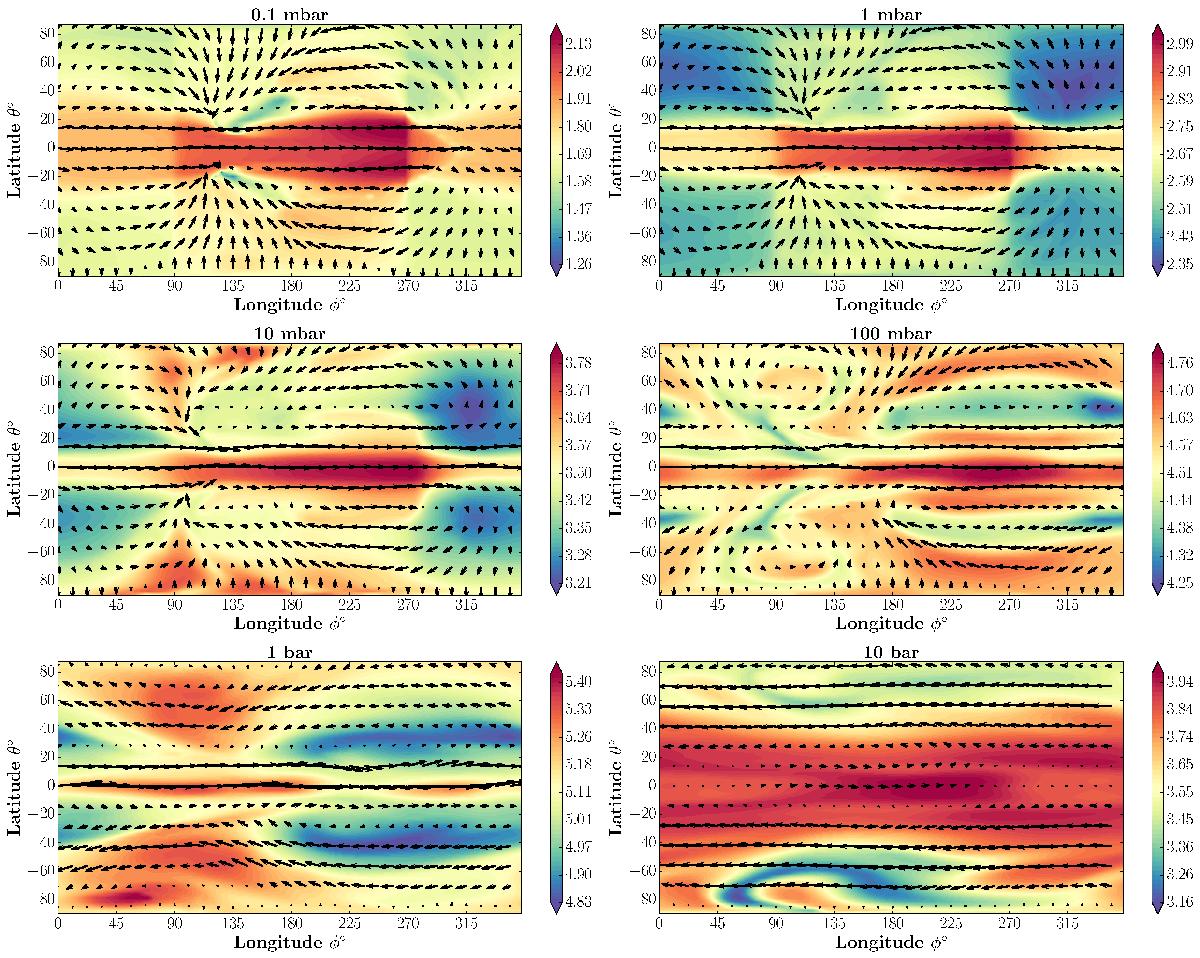
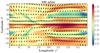
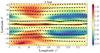
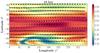
Cloud particle number density of grains log 10nd [cm-3] (colour bar) and velocity field (![]() ) at 0.1, 1, 10, 100 mbar and 1, 10 bar for different φ (longitudes) and θ (latitude). Note: the colour bar scale is different for each plot. The sub-stellar point is located at φ = 0°, θ = 0°. Grains are typically more concentrated at equatorial nightside regions. The number density increases until reaching a maximum near 1 bar, which then gradually falls until the lower computational boundary at ~100 bar. The grains follow the flow patterns in the upper atmosphere, showing a preference to transport cloud particles to nightside equatorial regions. Regions deeper than ~1 bar show a more uniform distribution of cloud particles in latitude and longitude.
) at 0.1, 1, 10, 100 mbar and 1, 10 bar for different φ (longitudes) and θ (latitude). Note: the colour bar scale is different for each plot. The sub-stellar point is located at φ = 0°, θ = 0°. Grains are typically more concentrated at equatorial nightside regions. The number density increases until reaching a maximum near 1 bar, which then gradually falls until the lower computational boundary at ~100 bar. The grains follow the flow patterns in the upper atmosphere, showing a preference to transport cloud particles to nightside equatorial regions. Regions deeper than ~1 bar show a more uniform distribution of cloud particles in latitude and longitude.
Current usage metrics show cumulative count of Article Views (full-text article views including HTML views, PDF and ePub downloads, according to the available data) and Abstracts Views on Vision4Press platform.
Data correspond to usage on the plateform after 2015. The current usage metrics is available 48-96 hours after online publication and is updated daily on week days.
Initial download of the metrics may take a while.