Fig. 3
Download original image
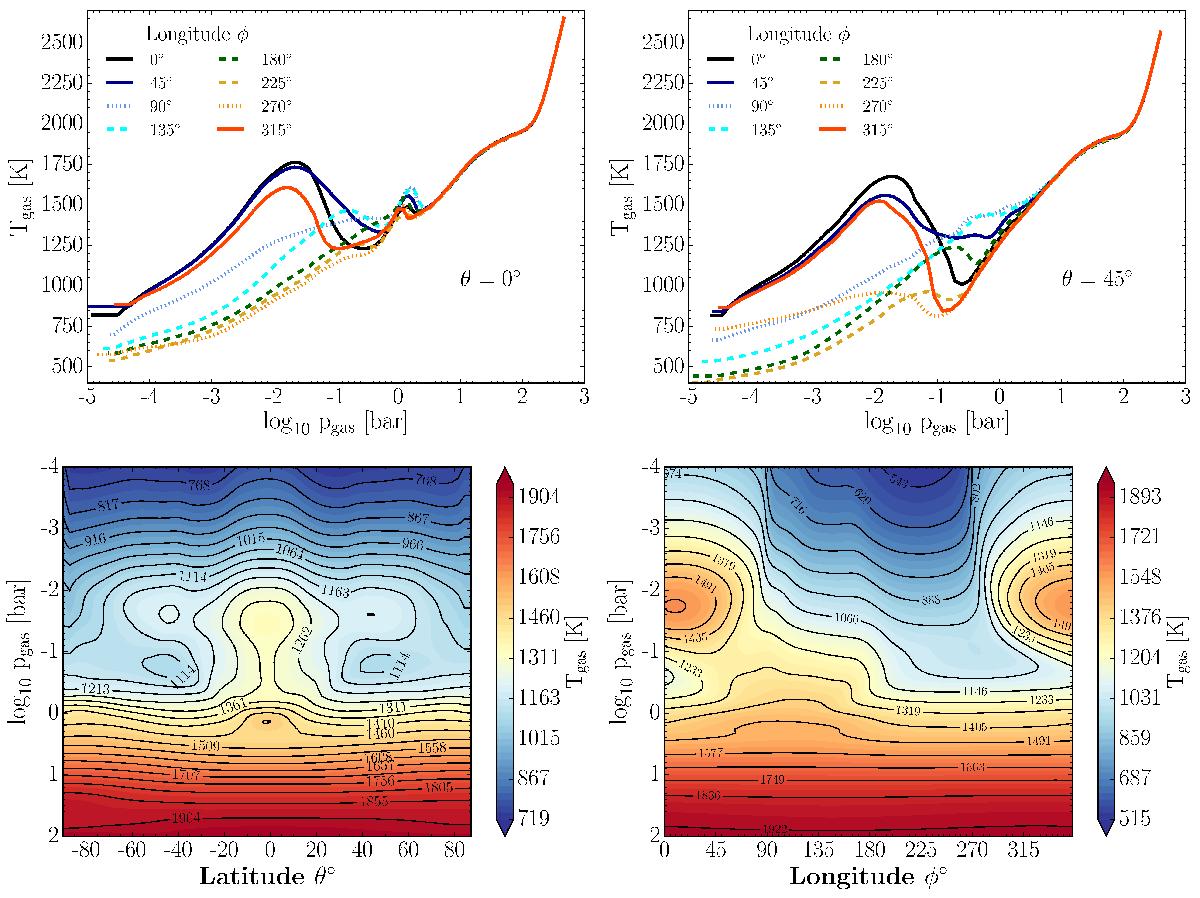
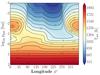
Top: 1D (Tgas, pgas) trajectories at latitudes θ = 0° (left) , 45° (right). Dayside profiles (solid) show steep temperature inversions at ~10 mbar, especially at higher latitudes. Nightside (dashed) and terminator (dotted) profiles have smaller inversions. Bottom: zonal (left) mean Tgas [K] as a function of atmospheric pressure and meridional (right) mean Tgas [K] as a function of atmospheric pressure. The largest differences in latitudinal temperature contrasts occur from 10 mbar to 1 bar. The temperature is generally isothermal at atmospheric regions at pressures >5 bar.
Current usage metrics show cumulative count of Article Views (full-text article views including HTML views, PDF and ePub downloads, according to the available data) and Abstracts Views on Vision4Press platform.
Data correspond to usage on the plateform after 2015. The current usage metrics is available 48-96 hours after online publication and is updated daily on week days.
Initial download of the metrics may take a while.