Fig. 15
Download original image
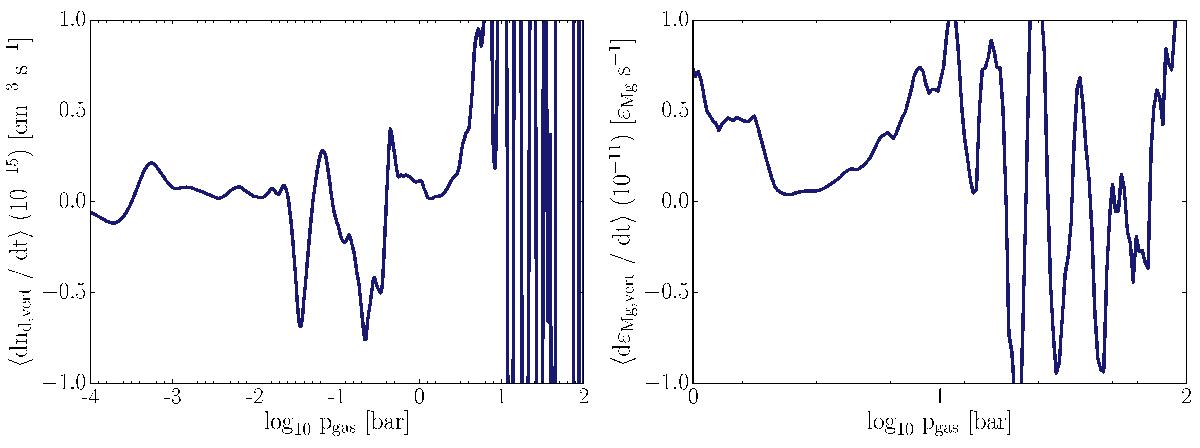
Snapshot horizontally and meridionally averaged iso-bars of the time dependent changes in nd (left) and εMg (right) due to the vertical advection. εMg is given in the range 1−100 bar to avoid the skewing of the global averages by dayside particle evaporation in the upper atmosphere. Settling of grains by the drift velocity is taken into account for the nd plot.
Current usage metrics show cumulative count of Article Views (full-text article views including HTML views, PDF and ePub downloads, according to the available data) and Abstracts Views on Vision4Press platform.
Data correspond to usage on the plateform after 2015. The current usage metrics is available 48-96 hours after online publication and is updated daily on week days.
Initial download of the metrics may take a while.