Fig. 13
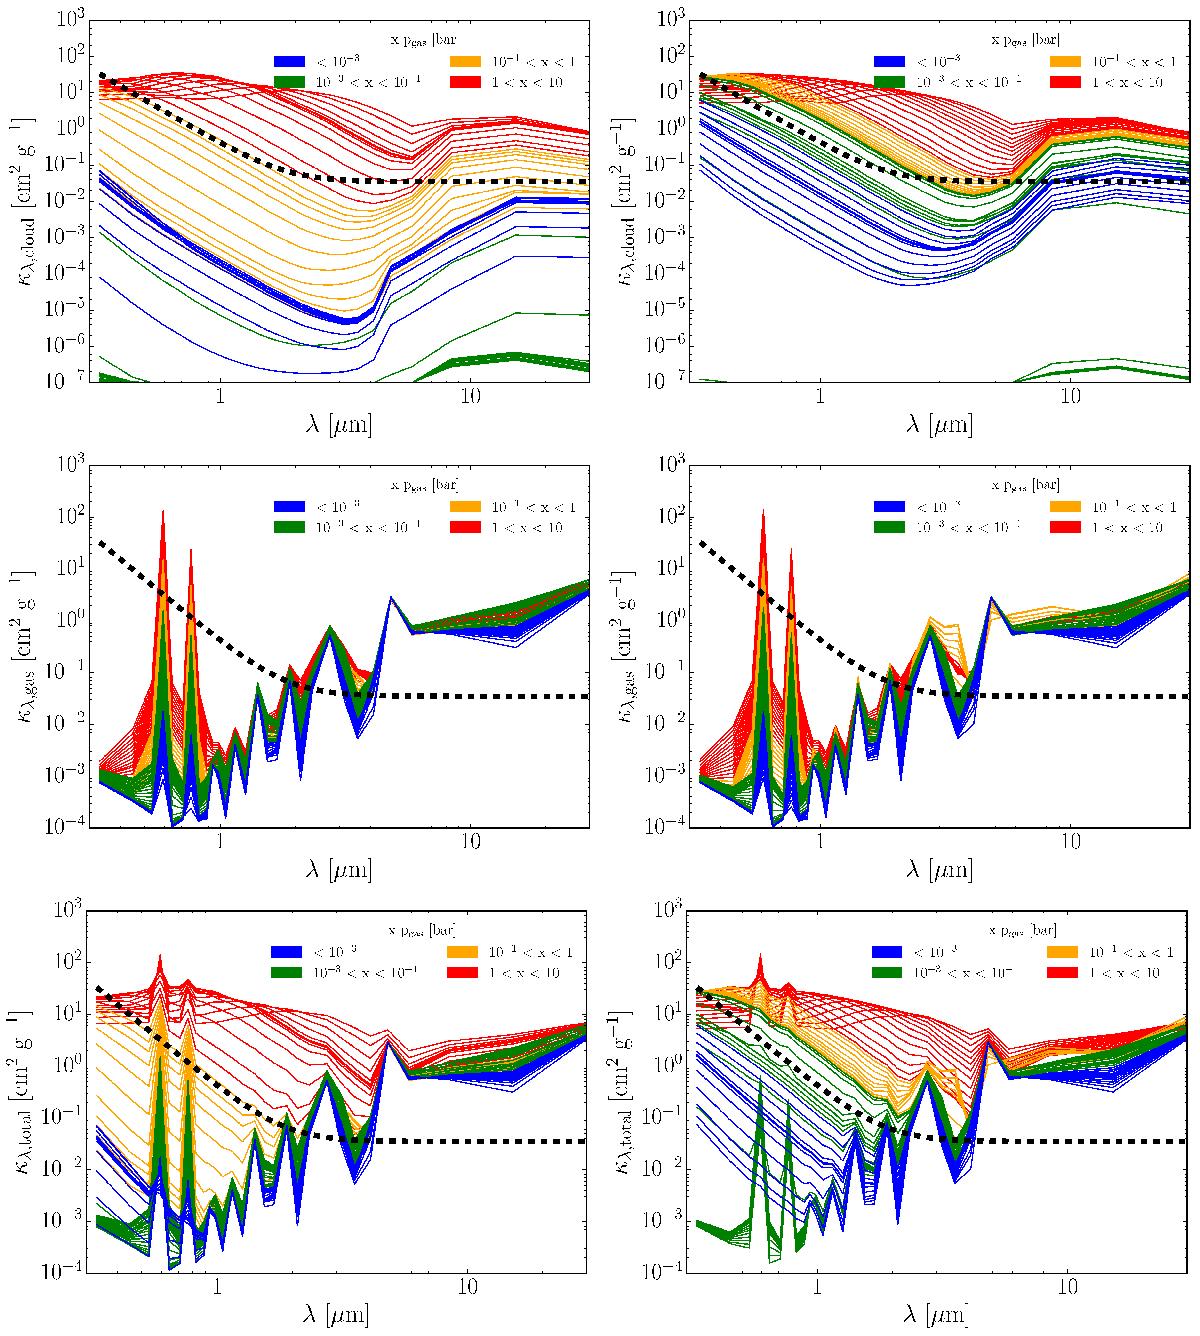
Download original image
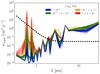
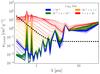
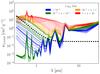
Cloud (top), gas (middle) and total (bottom) opacities at the sub-stellar point (left) and φ = 0°, θ = 45° (right) at the centre of each of the wavelength bands used in the RHD radiative transfer scheme. The thick dashed line shows the parameterised cloud opacity used in Dobbs-Dixon & Agol (2013), Eq. (31). The addition of the the size and composition dependent cloud opacity results in a more inhomogeneous opacity structure.
Current usage metrics show cumulative count of Article Views (full-text article views including HTML views, PDF and ePub downloads, according to the available data) and Abstracts Views on Vision4Press platform.
Data correspond to usage on the plateform after 2015. The current usage metrics is available 48-96 hours after online publication and is updated daily on week days.
Initial download of the metrics may take a while.