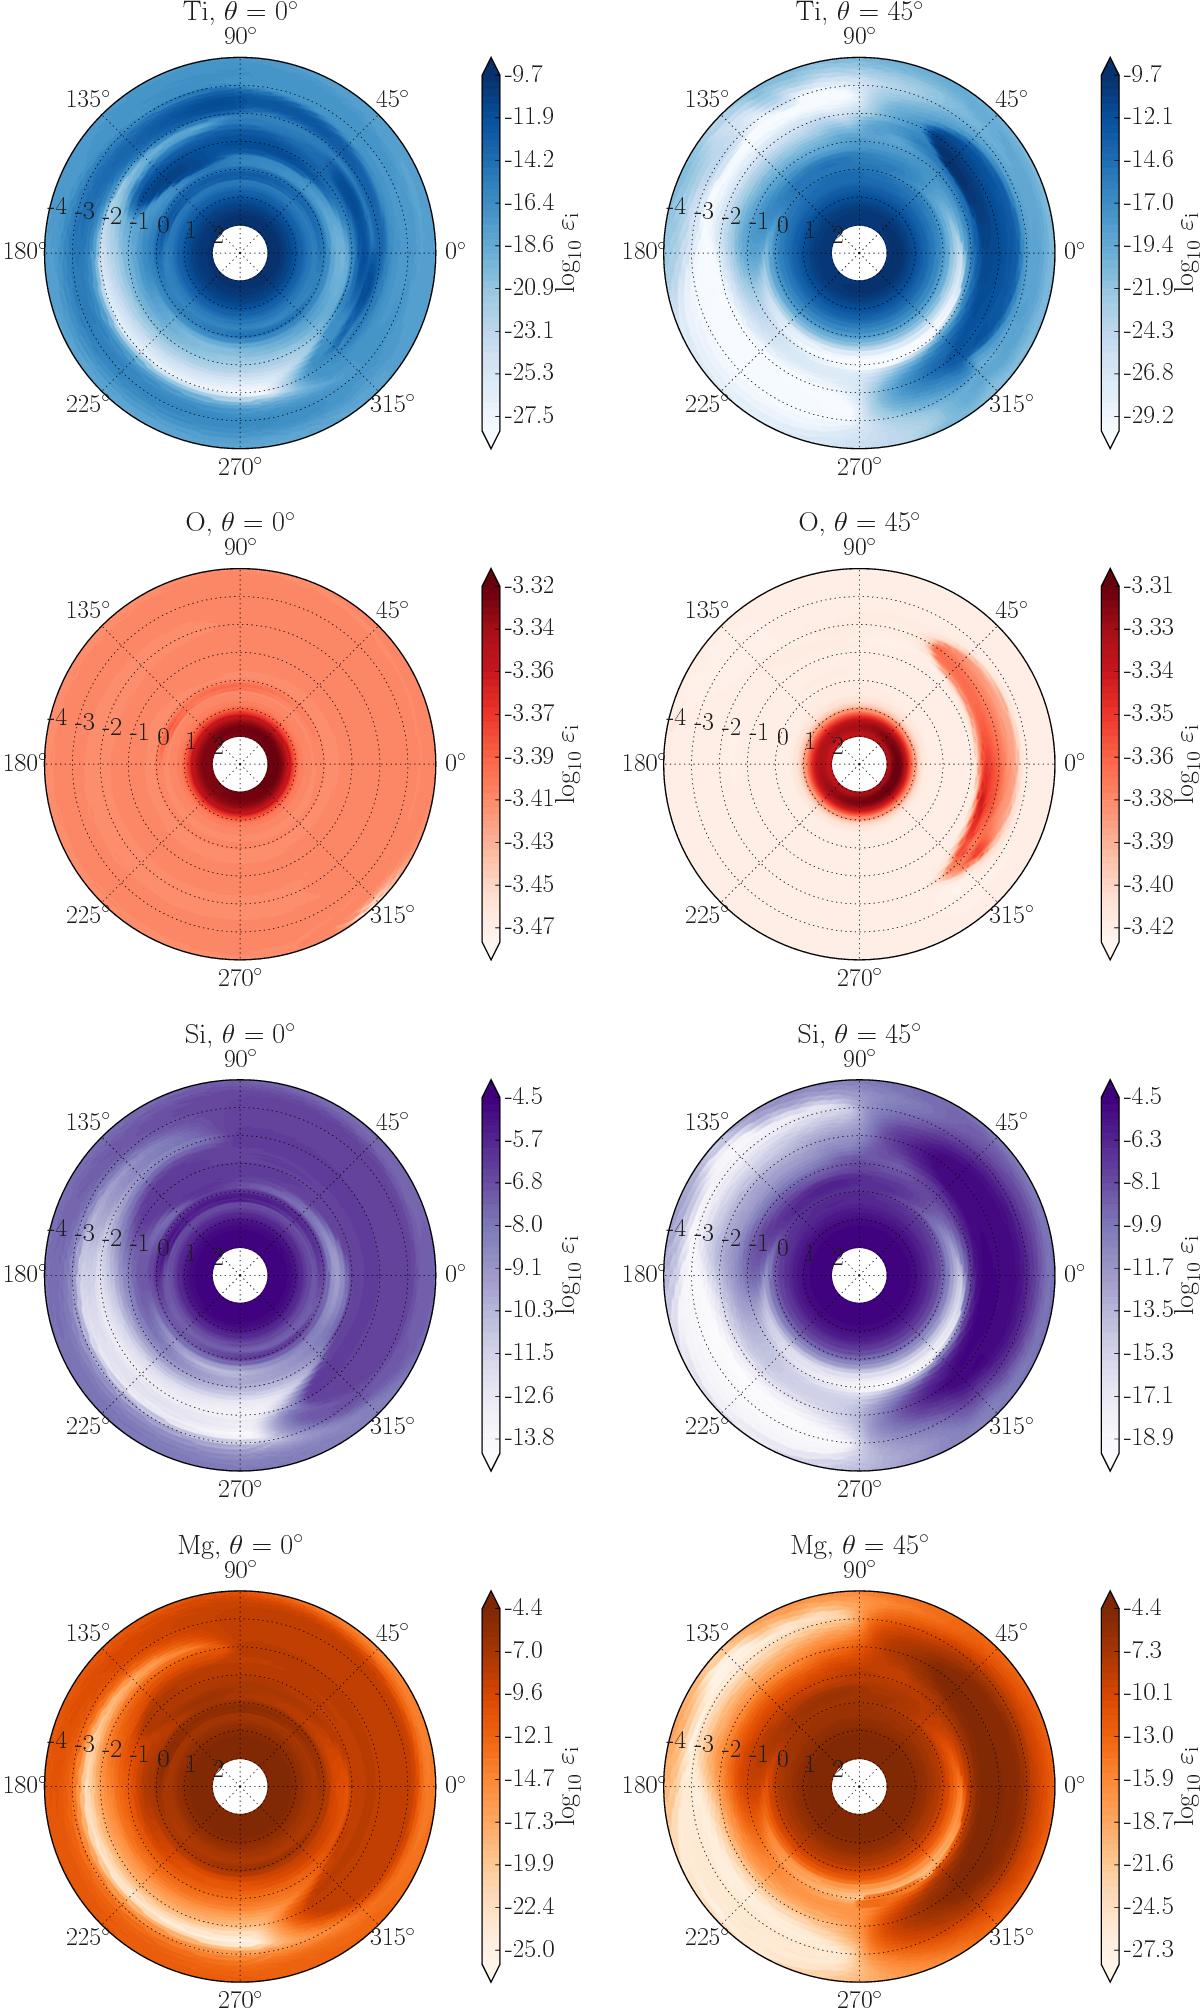
Fig. 12
Download original image
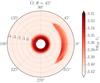
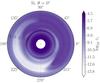
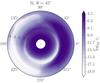
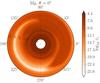
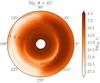
Meridional polar slices of gas phase element abundance log 10εi = ni/n⟨ H ⟩ (ratio i to hydrogen abundance) of top: Ti (blue), second row: O (red), third row: Si (purple) and fourth row: Mg (orange/brown) at θ = 0° (left) and θ = 45° (right), respectively. For reference, solar metallicity ![]() of the elements from Asplund et al. (2009) are, Ti: −7.05, O: −3.31, Si: −4.49, Mg: −4.40. Lighter coloured regions indicate a depletion of elements due to the cloud formation processes. Darker coloured regions indicate a local element abundance closer to the initial solar values. Outer circular values denote longitude at intervals of φ = 45° from the sub-stellar point (φ = 0°). Radial values indicate log 10pgas isobars from 0.1 mbar−100 bar. The globe is irradiated from the direction of the colour bars. Note: the size of the annulus is not scaled to planetary radius.
of the elements from Asplund et al. (2009) are, Ti: −7.05, O: −3.31, Si: −4.49, Mg: −4.40. Lighter coloured regions indicate a depletion of elements due to the cloud formation processes. Darker coloured regions indicate a local element abundance closer to the initial solar values. Outer circular values denote longitude at intervals of φ = 45° from the sub-stellar point (φ = 0°). Radial values indicate log 10pgas isobars from 0.1 mbar−100 bar. The globe is irradiated from the direction of the colour bars. Note: the size of the annulus is not scaled to planetary radius.
Current usage metrics show cumulative count of Article Views (full-text article views including HTML views, PDF and ePub downloads, according to the available data) and Abstracts Views on Vision4Press platform.
Data correspond to usage on the plateform after 2015. The current usage metrics is available 48-96 hours after online publication and is updated daily on week days.
Initial download of the metrics may take a while.