Fig. 9
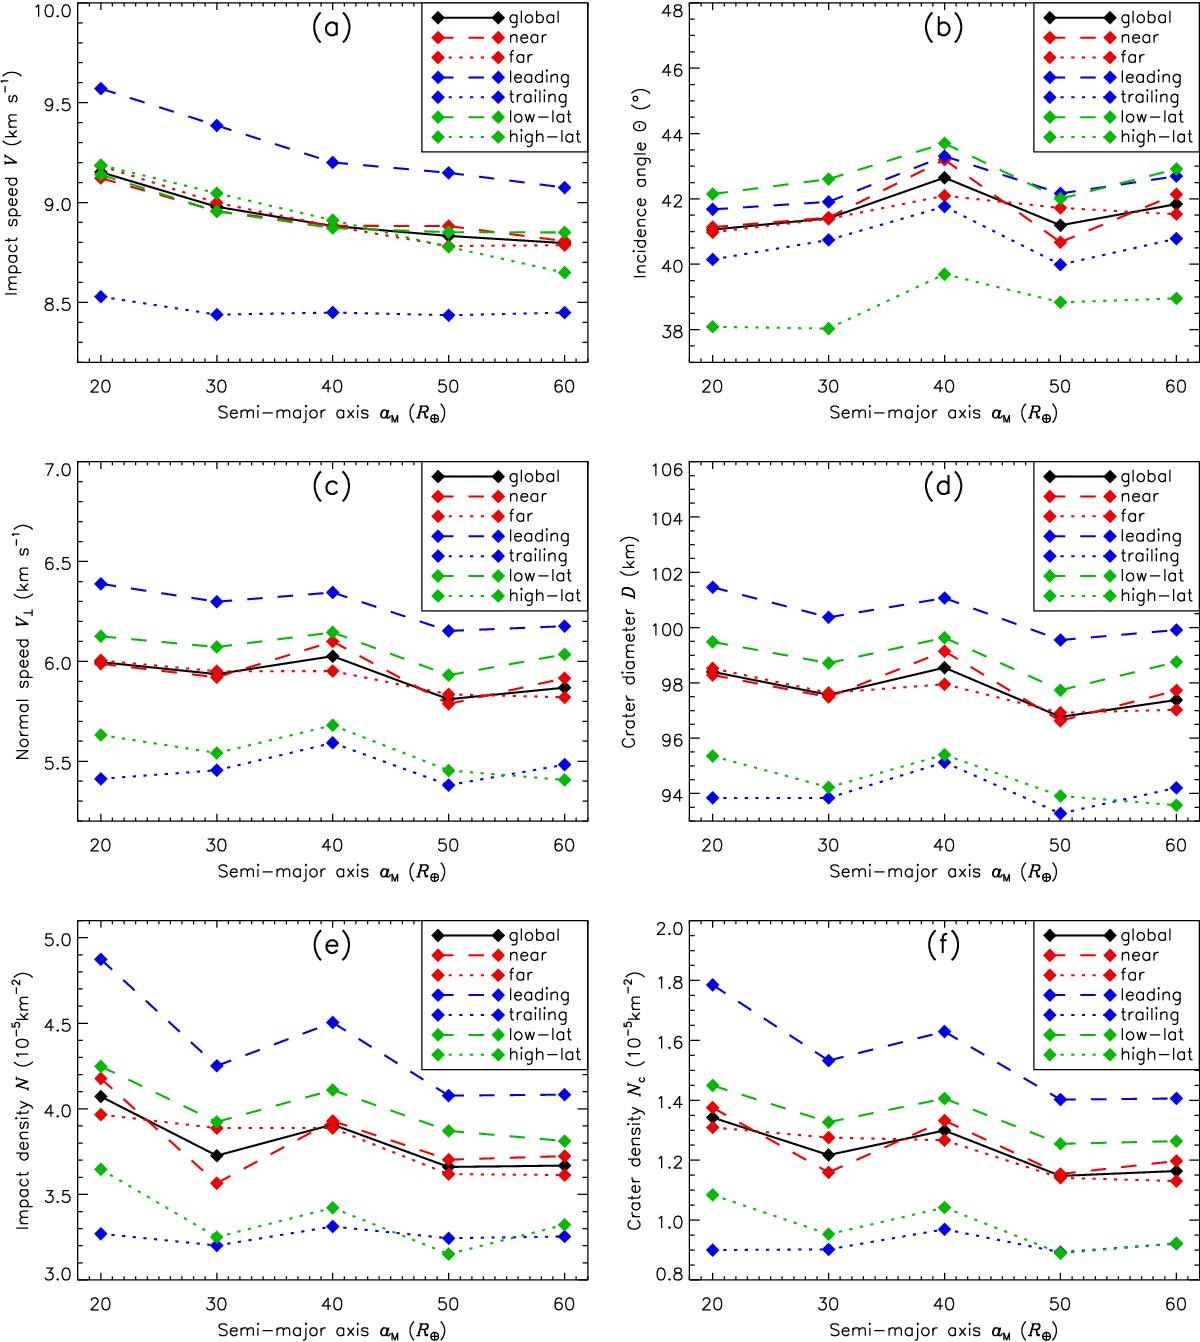
Regional impact speed a); incidence angle b); normal speed c); crater diameter d); impact density e); and crater density f) as functions of the lunar semi-major axis. The black squares connected by black solid lines are the global averages. The red squares connected by the red dashed and dotted lines are the averages on the near and far sides. The blue squares connected by the blue dashed and dotted lines are the averages on the leading and trailing sides. The green squares connected by the green dashed and dotted lines are the averages on the low- and high-latitude regions.
Current usage metrics show cumulative count of Article Views (full-text article views including HTML views, PDF and ePub downloads, according to the available data) and Abstracts Views on Vision4Press platform.
Data correspond to usage on the plateform after 2015. The current usage metrics is available 48-96 hours after online publication and is updated daily on week days.
Initial download of the metrics may take a while.