Fig. 11
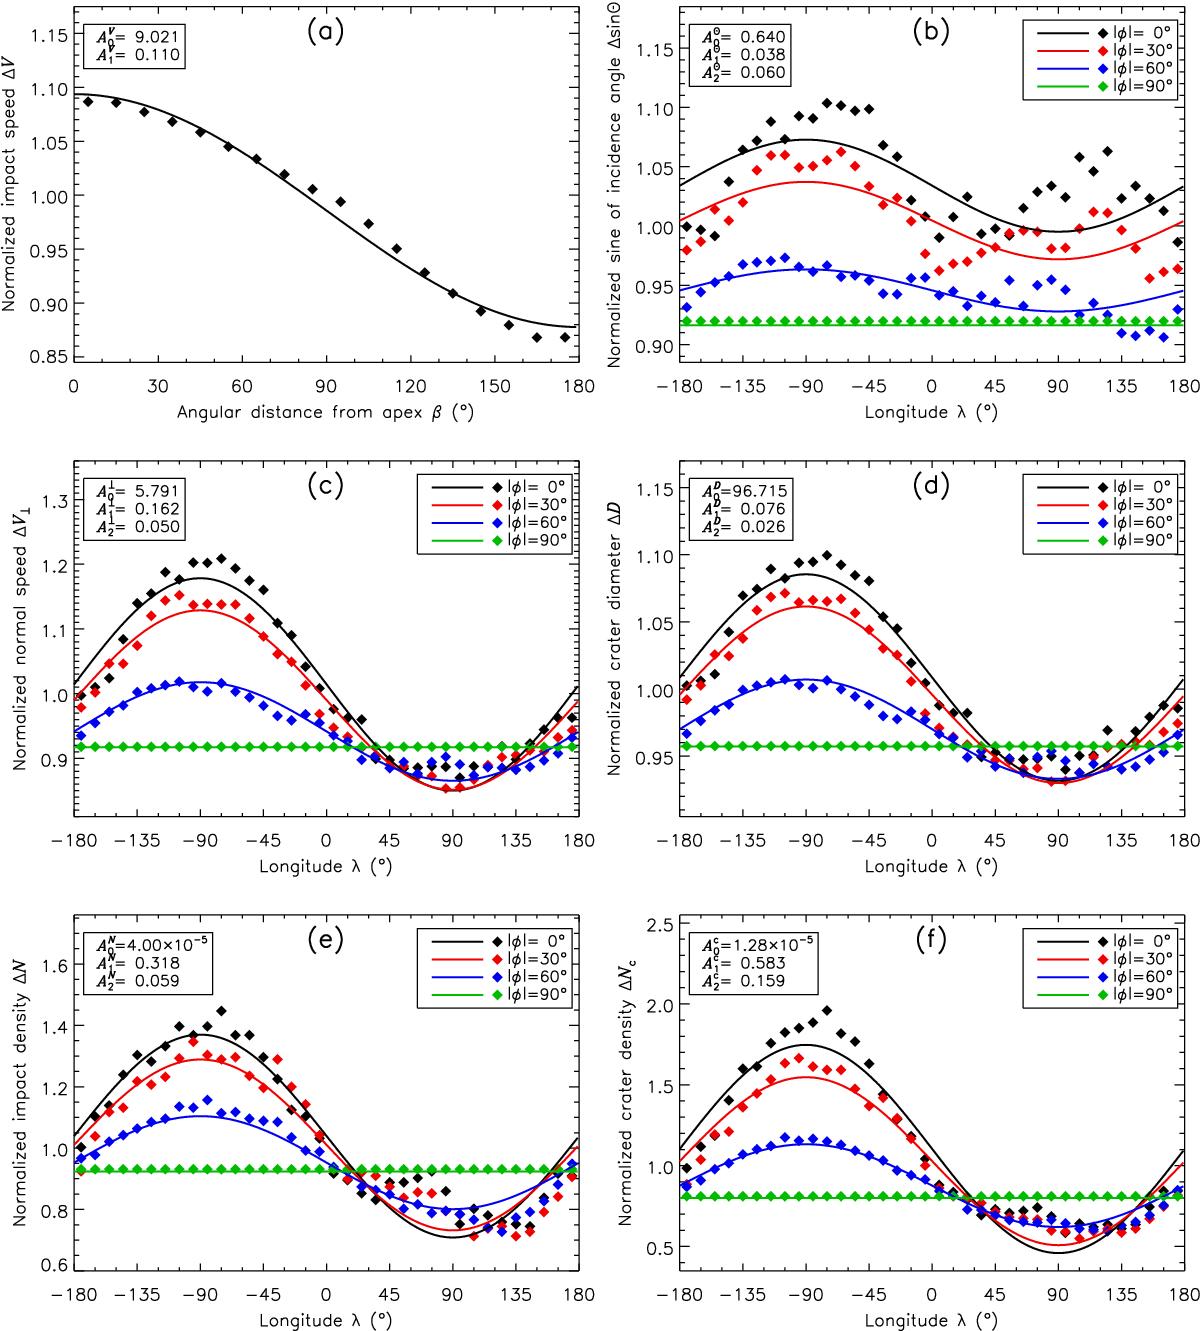
Impact speed as a function of angular distance from the apex a); and the incidence angle b); normal speed c); crater diameter d); impact density e); and crater density f) as functions of longitude, all in terms of simulated global averages. a) Data from the simulated distribution of the impact speed (black squares), each of which is the average over the small circle where β is fixed, are fit with Eq. (111). The best fit (black solid curve) is generated with plotted ![]() . b)−f) Data from simulated distributions, each of which is the mean of the two values at location (λ, ± ϕ) with | ϕ | being 0°, 30°, 60°, and 90° (black, red, blue, and green squares), are fit with Eqs. (112)−(116). The best fits (solid curves in the same color as the squares for the same | ϕ |) are generated with plotted A0,1,2.
. b)−f) Data from simulated distributions, each of which is the mean of the two values at location (λ, ± ϕ) with | ϕ | being 0°, 30°, 60°, and 90° (black, red, blue, and green squares), are fit with Eqs. (112)−(116). The best fits (solid curves in the same color as the squares for the same | ϕ |) are generated with plotted A0,1,2.
Current usage metrics show cumulative count of Article Views (full-text article views including HTML views, PDF and ePub downloads, according to the available data) and Abstracts Views on Vision4Press platform.
Data correspond to usage on the plateform after 2015. The current usage metrics is available 48-96 hours after online publication and is updated daily on week days.
Initial download of the metrics may take a while.