Fig. 9
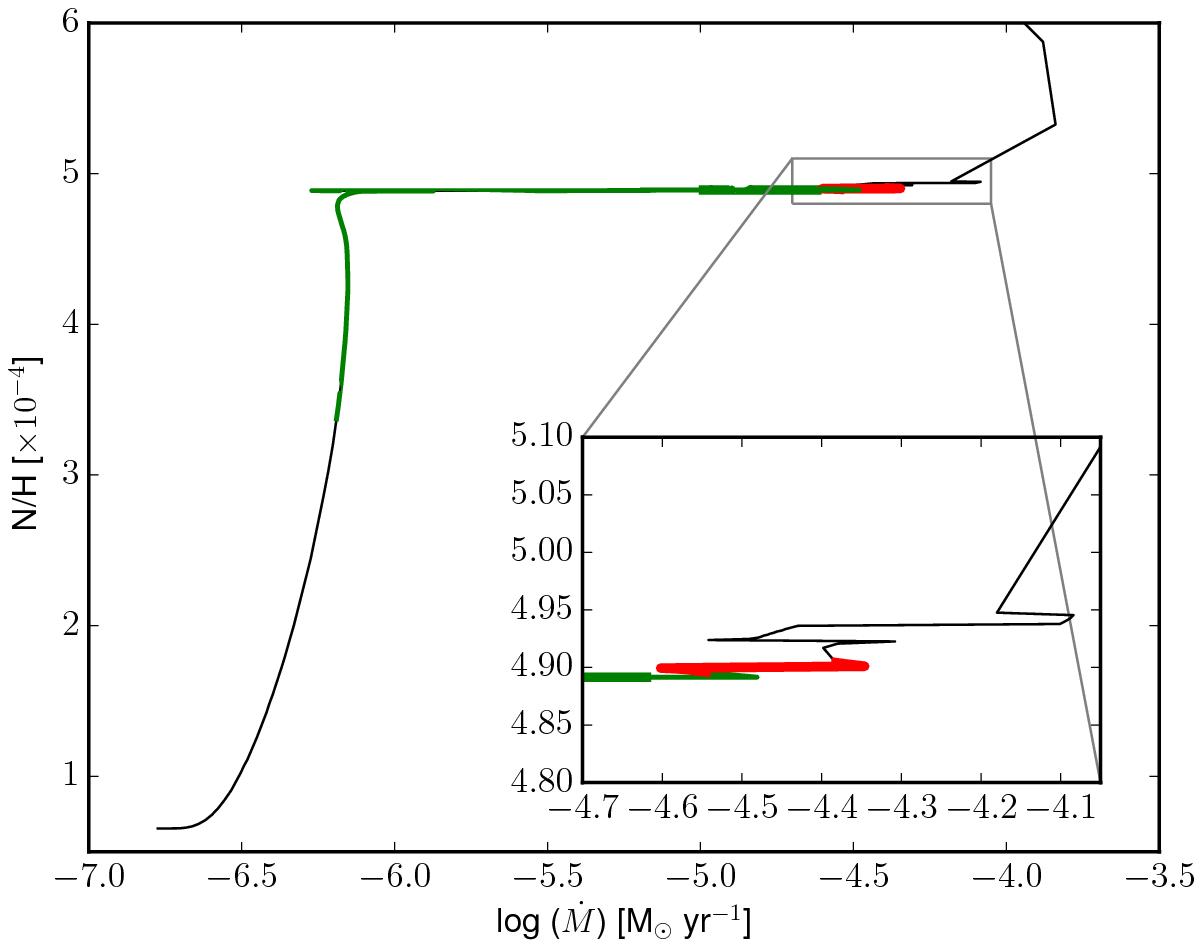
Evolution of the N abundance (in number) as a function of mass-loss rate for a 30 M⊙ star of solar metallicity and an initial rotational rate of 0.35. The evolutionary track comes from Ekström et al. (2012). The green line corresponds to the nitrogen abundance determined for the nebula from the Herschel/PACS data and the bold green line specifies where log Ṁ is between − 5.0 and − 4.6. The red line represents the location of the star according to the stellar N content and the stellar parameters from the CMFGEN model.
Current usage metrics show cumulative count of Article Views (full-text article views including HTML views, PDF and ePub downloads, according to the available data) and Abstracts Views on Vision4Press platform.
Data correspond to usage on the plateform after 2015. The current usage metrics is available 48-96 hours after online publication and is updated daily on week days.
Initial download of the metrics may take a while.