Free Access
Fig. 8
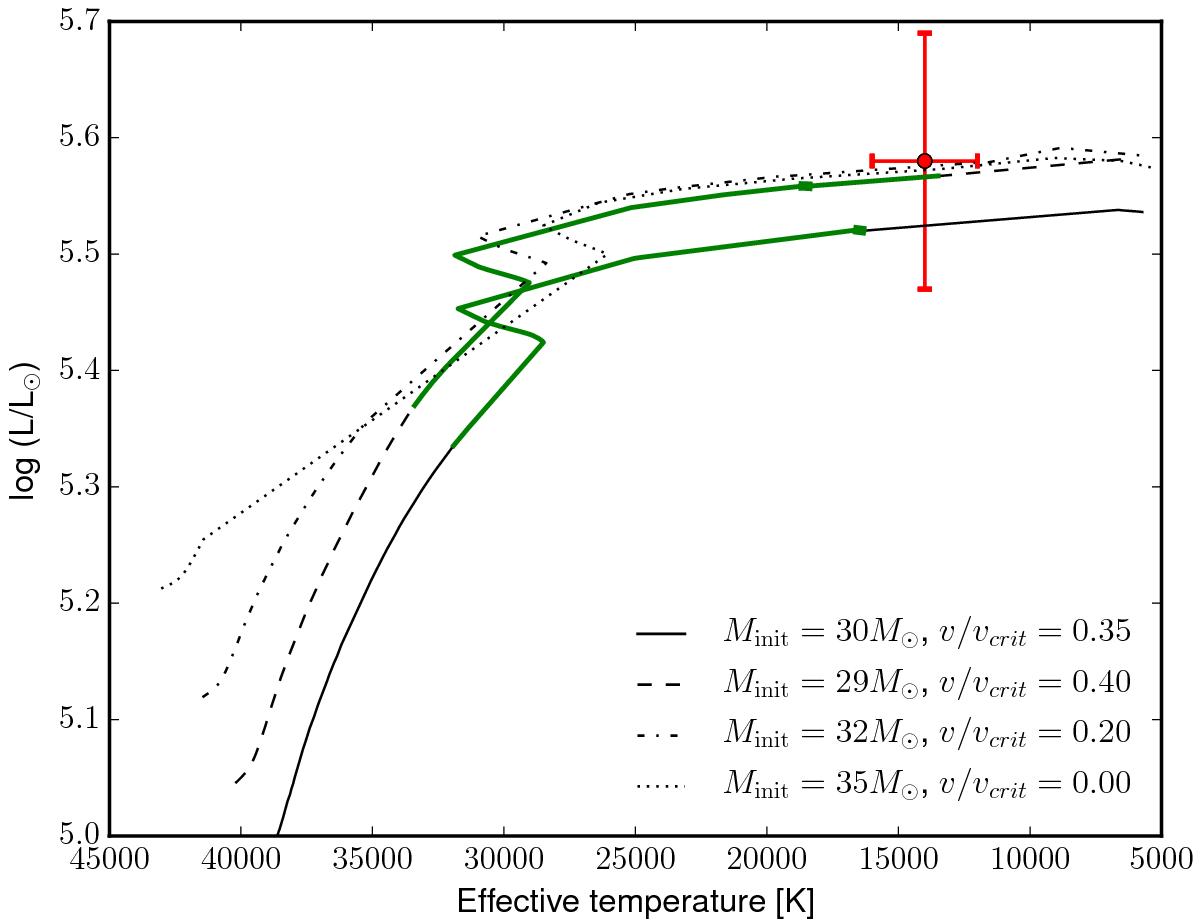
Location of HD 168625 (red) in the HR diagram and location at the time of the nebula ejection estimated from the abundances of the nebula (green). The bold green lines specify the location where, in addition, the mass-loss rates is between log Ṁ = −5.0 and log Ṁ = −4.6. Evolutionary tracks are from Ekström et al. (2012).
Current usage metrics show cumulative count of Article Views (full-text article views including HTML views, PDF and ePub downloads, according to the available data) and Abstracts Views on Vision4Press platform.
Data correspond to usage on the plateform after 2015. The current usage metrics is available 48-96 hours after online publication and is updated daily on week days.
Initial download of the metrics may take a while.