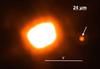
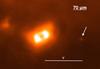
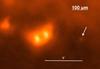
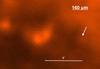
Fig. 3
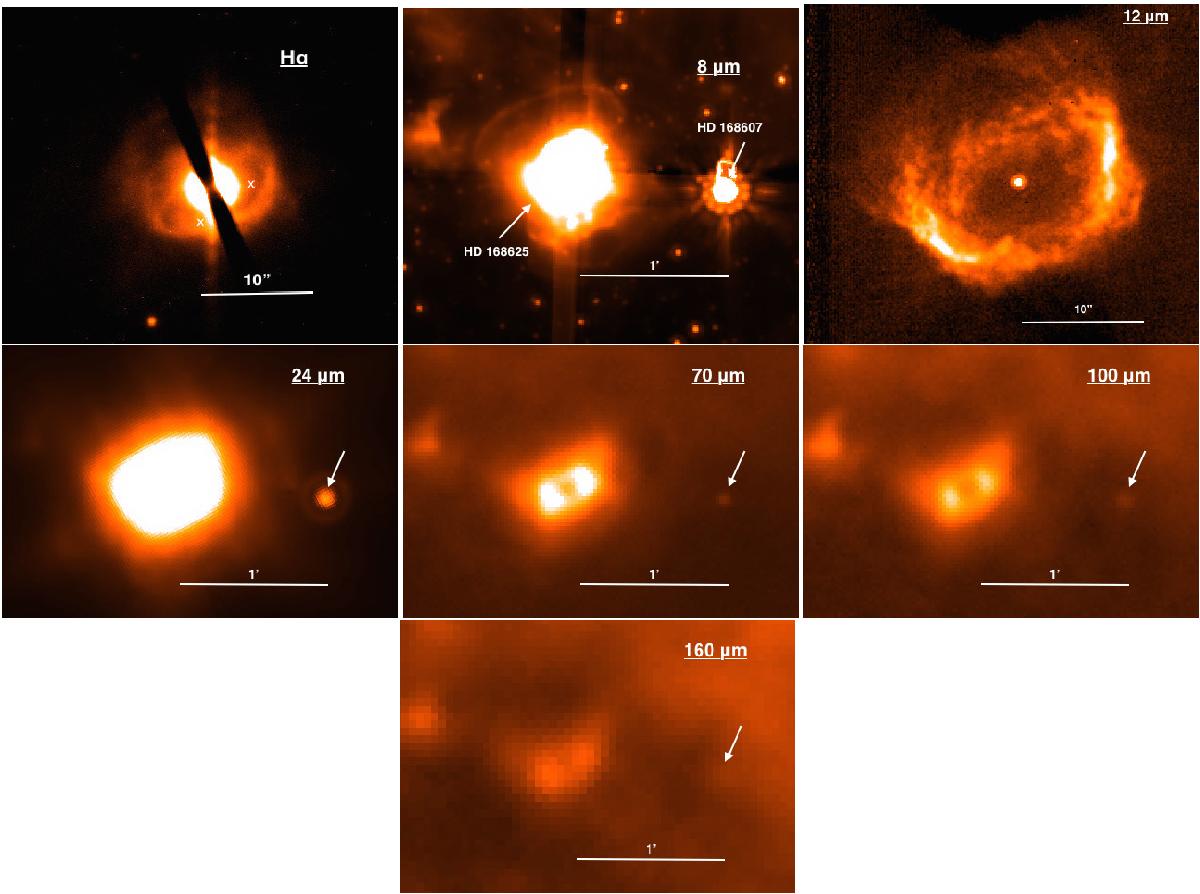
Top: from left to right: Hα image taken with SUSI on NTT (left), the 8 μm Spitzer image, and the 12 μm VLT/VISIR image. Middle: the MIPSGAL 24 μm image, the PACS 70 μm image and the PACS 100 μm image from left to right. Bottom: the PACS 160 μm images. For all the images, north is up and east is left. The white arrow indicates the location of the LBV HD 168607. In the Hα image of Nota et al. (1996), the crosses indicate the locations of the maxima of emission detected in the radio image of Leitherer et al. (1995). We emphasize that the 12 μm image is from Umana et al. (2010) and that the inner part of the 24 μm image is saturated.
Current usage metrics show cumulative count of Article Views (full-text article views including HTML views, PDF and ePub downloads, according to the available data) and Abstracts Views on Vision4Press platform.
Data correspond to usage on the plateform after 2015. The current usage metrics is available 48-96 hours after online publication and is updated daily on week days.
Initial download of the metrics may take a while.