Fig. 1
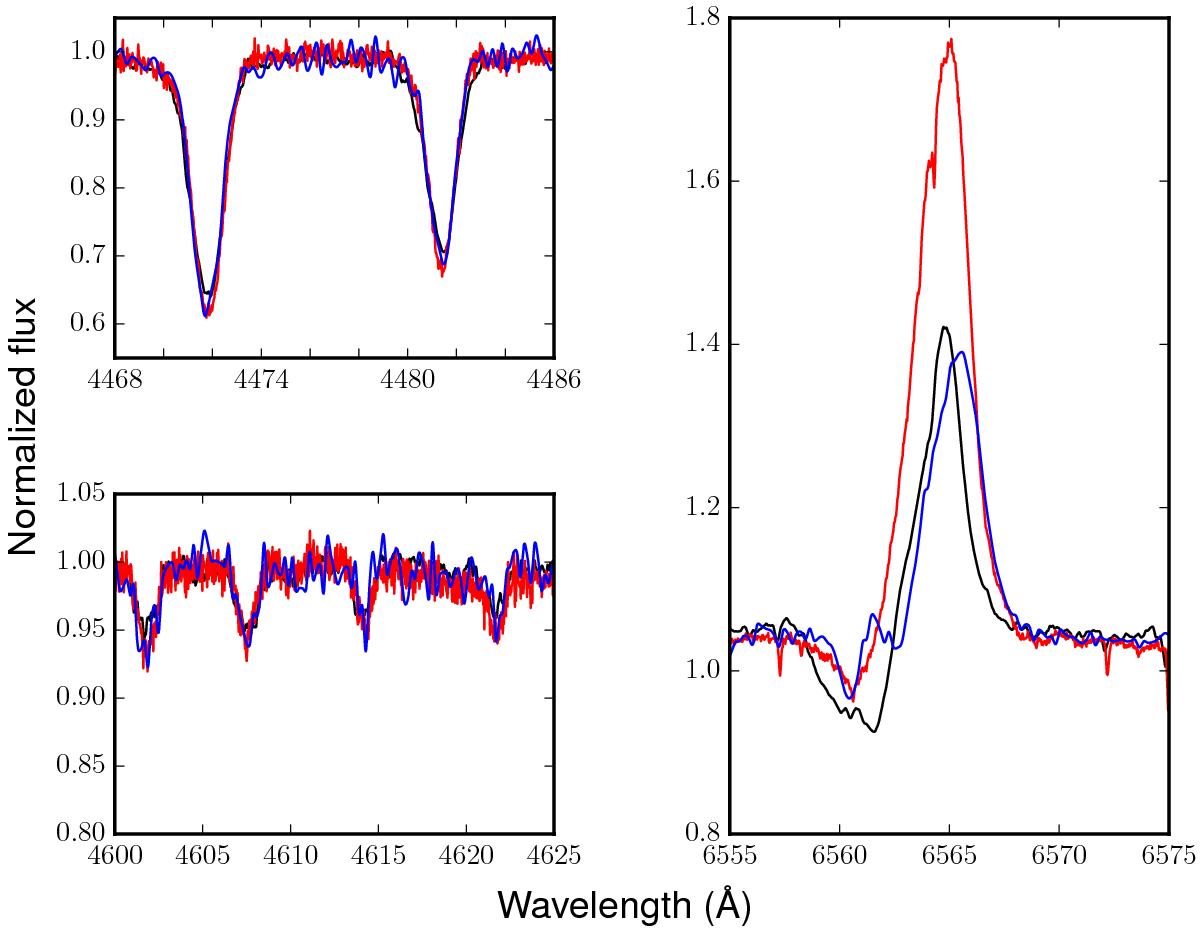
Comparison between the FEROS spectrum taken on June 29, 2002 (black line), the UVES spectrum taken on July 10, 2001 (red line) and the X-shooter spectrum taken on June 2, 2014 (blue line). The He i 4471 and the Mg ii 4481 lines are shown as effective temperature diagnostic, the N ii lines between 4600 and 4625 Å as nitrogen content indicator, and the Hα line for the stellar wind variations.
Current usage metrics show cumulative count of Article Views (full-text article views including HTML views, PDF and ePub downloads, according to the available data) and Abstracts Views on Vision4Press platform.
Data correspond to usage on the plateform after 2015. The current usage metrics is available 48-96 hours after online publication and is updated daily on week days.
Initial download of the metrics may take a while.