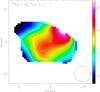
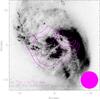
Fig. 6

12CO-to-13CO integrated intensity line ratio (ℛ10) map (left) and overlay of the same in contours on top of an HST ACS F435W filter gray-scale image (right). The ratio decreases from about 40−45 at the northwestern edge down to ~30 along the nuclear dust lane, and ~10–20 at the northeastern, eastern, and western edges. ℛ10 seems to be quite constant along the nuclear dust lane until the ratio steeply increases toward the dust lane in the west. North is up, east to the left, and the beam is shown in the lower right corner of each map. The cross marks the position of the phase center.
Current usage metrics show cumulative count of Article Views (full-text article views including HTML views, PDF and ePub downloads, according to the available data) and Abstracts Views on Vision4Press platform.
Data correspond to usage on the plateform after 2015. The current usage metrics is available 48-96 hours after online publication and is updated daily on week days.
Initial download of the metrics may take a while.