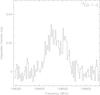
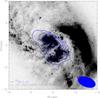
Fig. 3

Spectrum of the 13CO 1−0 emission in NGC 1614 (channel width: 10 km s-1, left), and overlay of the integrated emission contours on top of an HST ACS F435W filter gray-scale image (right). The contours in the map obtained from natural weighting start at 4σ and are spaced in steps of 3σ. The 1σ sensitivity here is ~1.4 mJy beam-1. The beam (see Table 1) is depicted in the bottom right corner. The cross marks the phase center. North is up, east to the left.
Current usage metrics show cumulative count of Article Views (full-text article views including HTML views, PDF and ePub downloads, according to the available data) and Abstracts Views on Vision4Press platform.
Data correspond to usage on the plateform after 2015. The current usage metrics is available 48-96 hours after online publication and is updated daily on week days.
Initial download of the metrics may take a while.