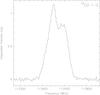
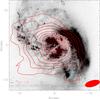
Fig. 2

12CO 1−0 emission in NGC 1614. The spectrum of the 12CO 1−0 emission with a channel width of 10 km s-1 is shown on the left, an overlay of the integrated emission contours on top of an HST ACS F435W filter gray-scale image is shown on the right. The integrated intensity map was obtained using uniform weighting. The resulting 1σ sensitivity is ~1.6 mJy beam-1, the synthesized beam (see Table 1) is depicted in the lower right corner. The first three contour levels are at 3σ, 13σ, and 23σ. For legibility purposes, the next contour is at 50σ; from there on the subsequent contours are spaced by 50σ until the peak flux is reached. The cross marks the phase center. North is up, east to the left.
Current usage metrics show cumulative count of Article Views (full-text article views including HTML views, PDF and ePub downloads, according to the available data) and Abstracts Views on Vision4Press platform.
Data correspond to usage on the plateform after 2015. The current usage metrics is available 48-96 hours after online publication and is updated daily on week days.
Initial download of the metrics may take a while.