Free Access
Fig. 6
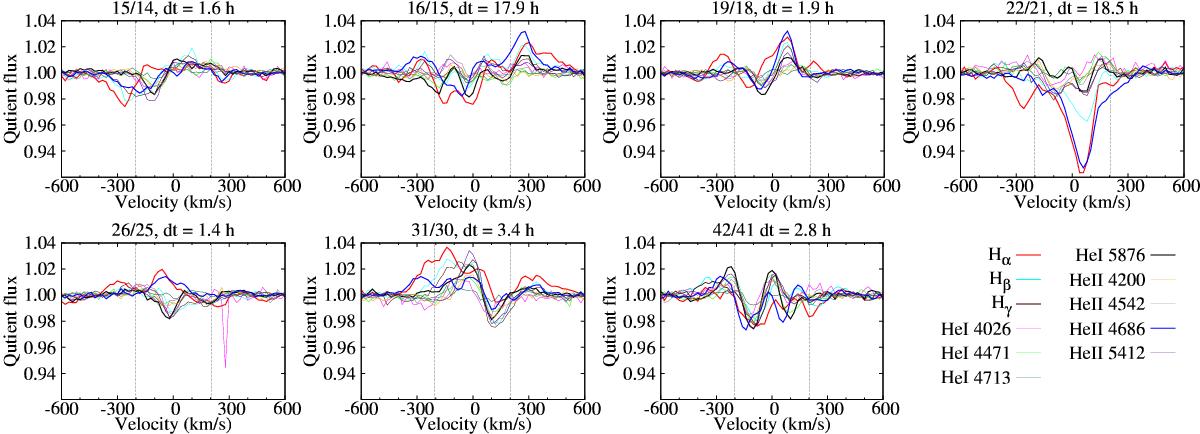
Selected sample of subsequent quotient spectra of different lines from the 2013 dataset. The top label denotes the sequence numbers used for the quotient and the time difference between them. The legend gives the color codes used. The description of the individual panels is given in Sect. 4.2.
Current usage metrics show cumulative count of Article Views (full-text article views including HTML views, PDF and ePub downloads, according to the available data) and Abstracts Views on Vision4Press platform.
Data correspond to usage on the plateform after 2015. The current usage metrics is available 48-96 hours after online publication and is updated daily on week days.
Initial download of the metrics may take a while.