Fig. 4
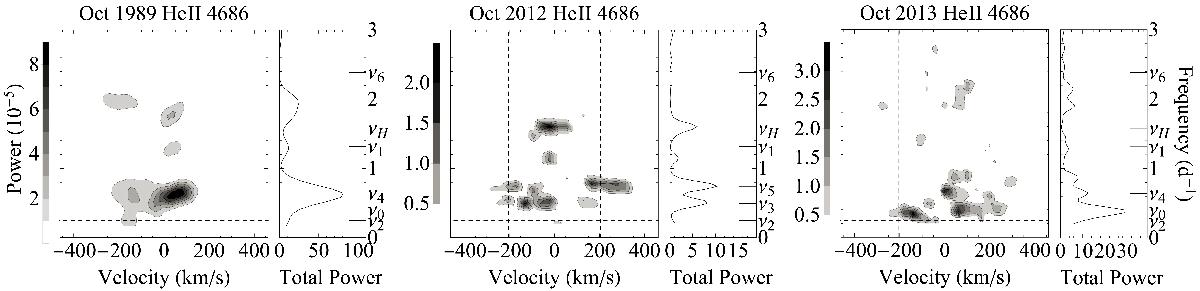
From left to right: grayscale representation of the CLEANed periodograms as a function of velocity of He ii λ4686 spectra for the 1989, 2012, and 2013 datasets. For the layout see Fig. 2. Vertical dashed lines in the main panels are drawn at ± vsini. For the full profiles see Fig. 3. The tickmark at ν1 = 1.315 d-1 indicates the frequency with the strongest power in this line in August 2013 (see RH15), which is absent in our three datasets. The tickmarks at ν2 = 0.245 d-1 (=4.1 d, our adopted rotation period) and ν3 = 0.495 d-1 indicate the frequencies found in Hα in August 2013 by RH15. The dominant frequencies at ν0 in the Si iv in 1989 and at ν4 = 0.642 d-1 (1.56 d) are drawn at the peaks of the 1989 and 2013 dataset, respectively. The dominant peak in 2012 is at ν5 = 0.741 d-1 (1.35 d). The tickmark at νH = 1.5808 d-1 (=0.6326 d) denotes the periodicity derived from the Hipparcos lightcurve by Marchenko et al. (1998), which is remarkably present in 2012. The indicated frequency ν6 = 2.386 d-1 is absent in this line, but present in nearly all other helium lines in 2013, see Table 5.
Current usage metrics show cumulative count of Article Views (full-text article views including HTML views, PDF and ePub downloads, according to the available data) and Abstracts Views on Vision4Press platform.
Data correspond to usage on the plateform after 2015. The current usage metrics is available 48-96 hours after online publication and is updated daily on week days.
Initial download of the metrics may take a while.