Fig. C.1
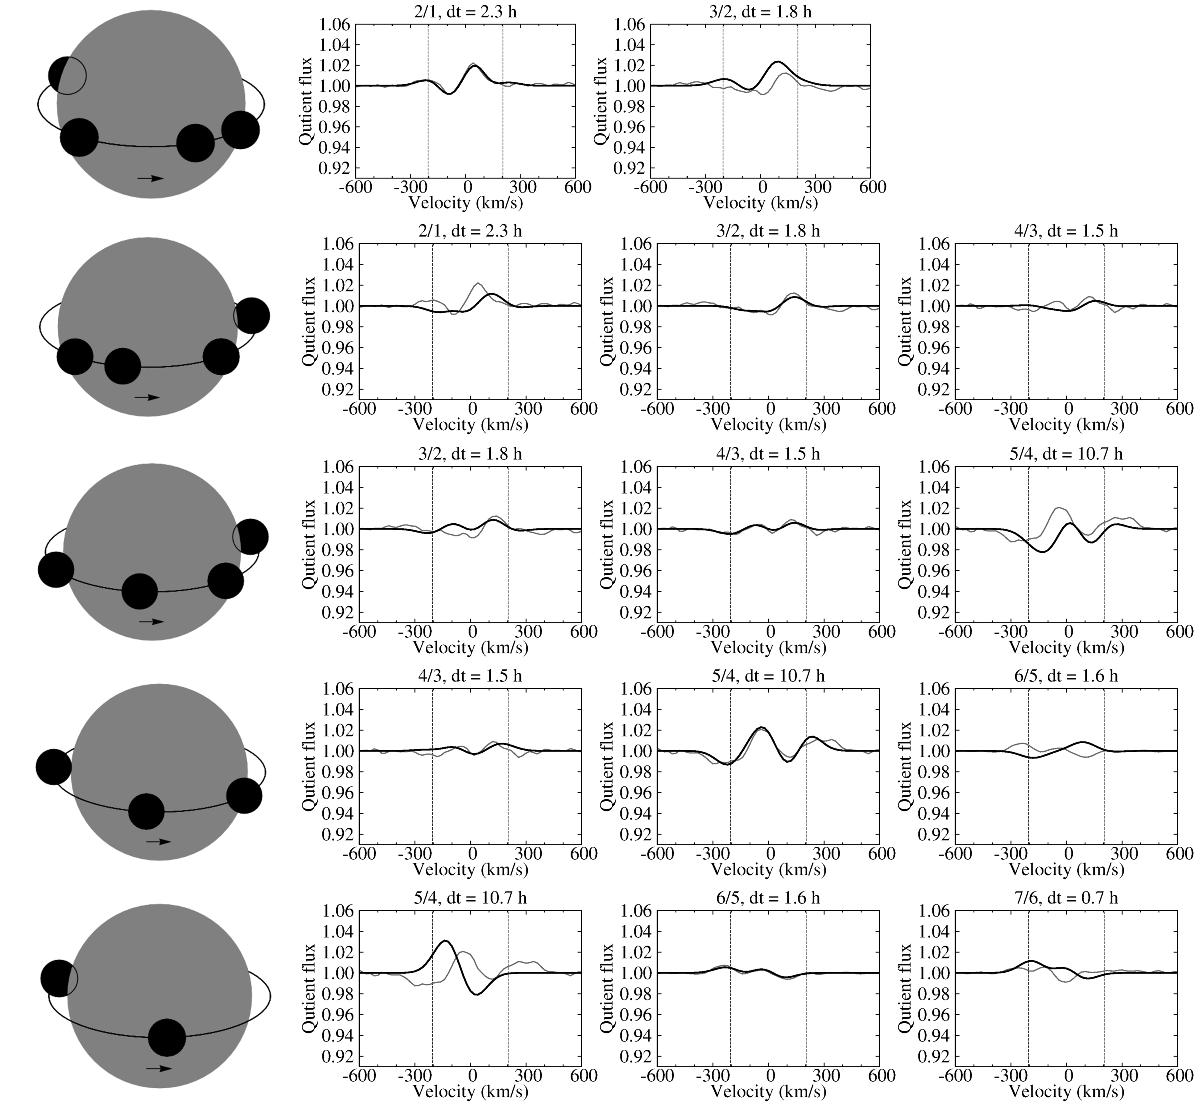
Model fits (black thick lines) for subsequent quotient spectra (gray thin lines) of the 1989 dataset, spectra 1−7. The top label gives the sequence numbers of the two spectra of the quotient, followed by their time interval in hours. The geometry, which is depicted at the beginning of each series, is used for all figures in the sequence and is shown for the epoch of the first spectrum of the second panel in the series. The star rotates with the blobs staying in their same relative position. The first and last figures of each series (except the very first and very last for obvious reasons) contain intentionally failed fits to signify the extent over which the fitted configuration, carried around by the rotation, survives. In this dataset most configurations have short lifetimes, unlike the other datasets. The fits continue in the next figure.
Current usage metrics show cumulative count of Article Views (full-text article views including HTML views, PDF and ePub downloads, according to the available data) and Abstracts Views on Vision4Press platform.
Data correspond to usage on the plateform after 2015. The current usage metrics is available 48-96 hours after online publication and is updated daily on week days.
Initial download of the metrics may take a while.