Fig. 3
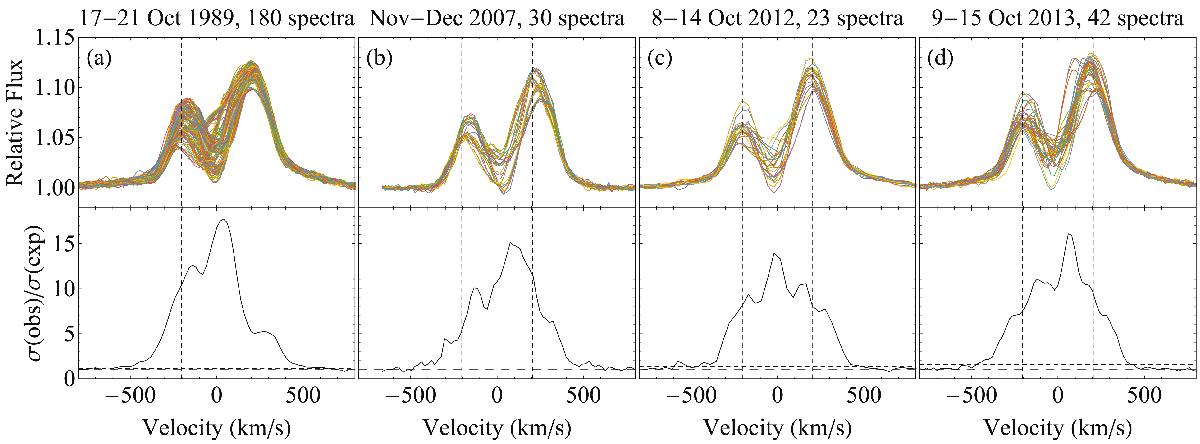
Top panels: overplots of He ii λ4686 spectra, showing dramatic changes on short and long timescales. The spectra have been rebinned such that the S/N equals 810 in all four panels. Vertical dashed lines are drawn at ± vsini. Lower panels: temporal variance spectra expressed as the ratio of the observed to the expected standard deviation, σobs/σexp (similar to TVS1/2). The lower long-dashed horizontal line is drawn at unity. The upper horizontal short-dashed line indicates the 1% significance level. From left to right: a) acquired at Calar Alto and Kitt Peak in 1989 with shortest time resolution of about 15 min. The corresponding periodogram is in the left-hand panel of Fig. 4; b) acquired at BOAO in 2007, spanning 27 days; c) acquired at the Mercator telescope in 2012 with its corresponding periodogram shown in the middle panel of Fig. 4; d) acquired at the Mercator telescope in 2013. The corresponding periodogram is in the right-hand panel of Fig. 4.
Current usage metrics show cumulative count of Article Views (full-text article views including HTML views, PDF and ePub downloads, according to the available data) and Abstracts Views on Vision4Press platform.
Data correspond to usage on the plateform after 2015. The current usage metrics is available 48-96 hours after online publication and is updated daily on week days.
Initial download of the metrics may take a while.